Risk Indicators Remain Bullish // Comparing the Current Advance with October // Volume Flows Strong in SPY // Industrials and Technology Maintain Top Position // Utilities and Staples Start Slacking // Webinar Video ////
Risk Indicators Remain Bullish
There is not much change in the overall picture for the stock market - and the other markets for that matter. Most of my focus is on the immediate uptrends, which began in mid-January or mid-February. This rally was fueled by a decline in Treasury bonds as money moved from relative safe-havens to riskier assets. We also saw money move from the defensive sectors to offensive sectors in mid February and small-caps started outperforming large-caps. The chart below shows some of these risk indicators and they remain in bull mode.
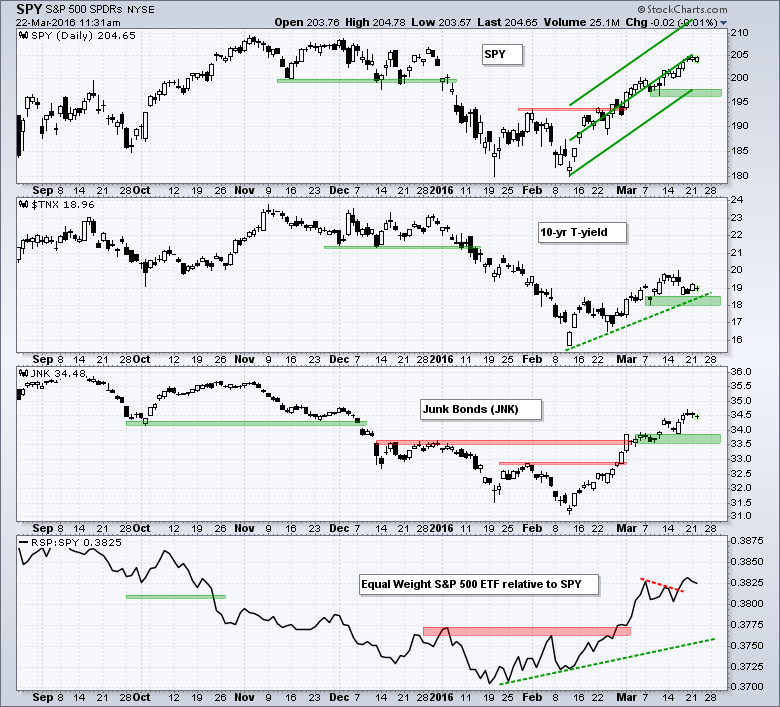
The 10-YR Treasury Yield ($TNX) is rising as long as it holds above 18 (1.8%). There is a positive correlation between Treasury yields and stocks so this is bullish. Furthermore, an uptrend in yields implies a downtrend in Treasury bonds. The High Yield Bond SPDR (JNK) remains in an uptrend with support marked in the 33.5-34 zone. This reflects continued easing in the credit markets and this is positive. The EW S&P 500 ETF (RSP) resumed outperformance as the RSP:SPY ratio surged last week. Relative strength in the equal-weight S&P 500 shows a good risk appetite.
Comparing the Current Advance with October
I realize that two data points do not make a trend, but there are some interesting similarities between the October surge and the current surge. Both featured a bullish breadth thrust when the 10-day EMA for S&P 1500 AD Percent ($SUPADP) moved above +30%. S&P 500 HiLo% ($SPXHLP) turned bullish with a move above +10%, but there were no confirming signals from the S&P Small-Cap 600 and S&P MidCap 400. The October surge ultimately failed, but the current surge is still going strong.
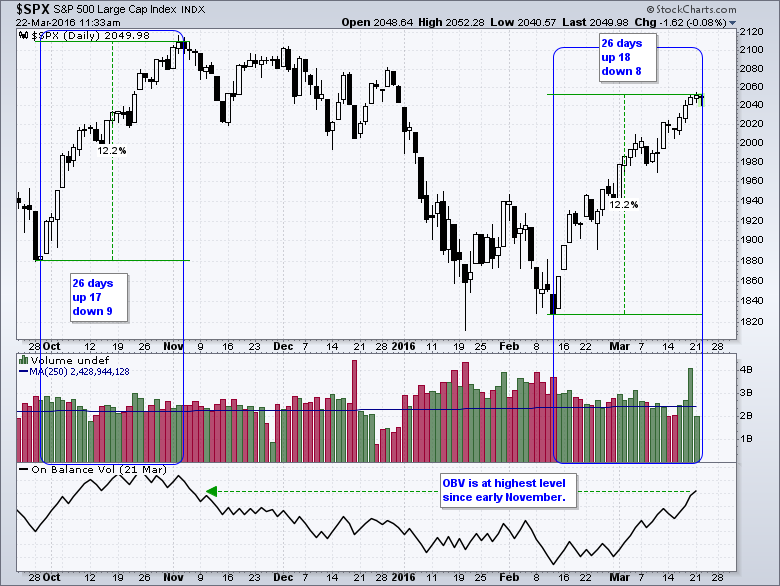
The October surge extended 26 days with 17 up and 9 down. The current surge is now 26 days old with 18 up and 9 down. The S&P 500 advanced around 12% both times (closing low to closing high). We are due for a pullback, but timing such a pullback is another story because there really is no such thing as overbought. For those interested in volume, note that up volume over the last 26 days is respectable and OBV is at its highest level since early November.
Volume Flows Strong in SPY
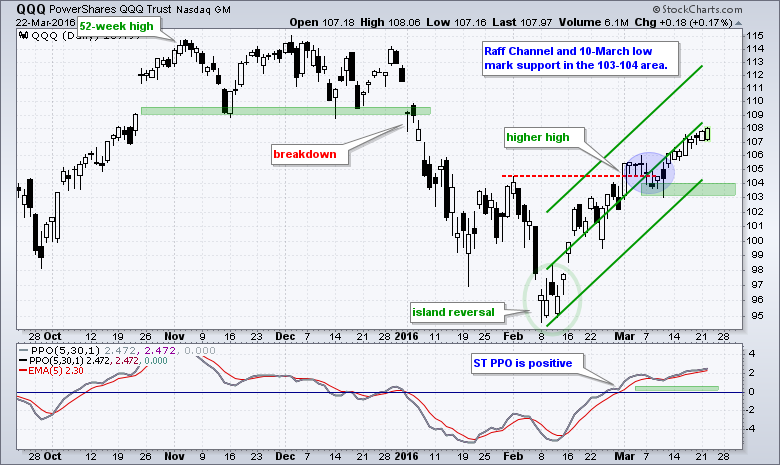
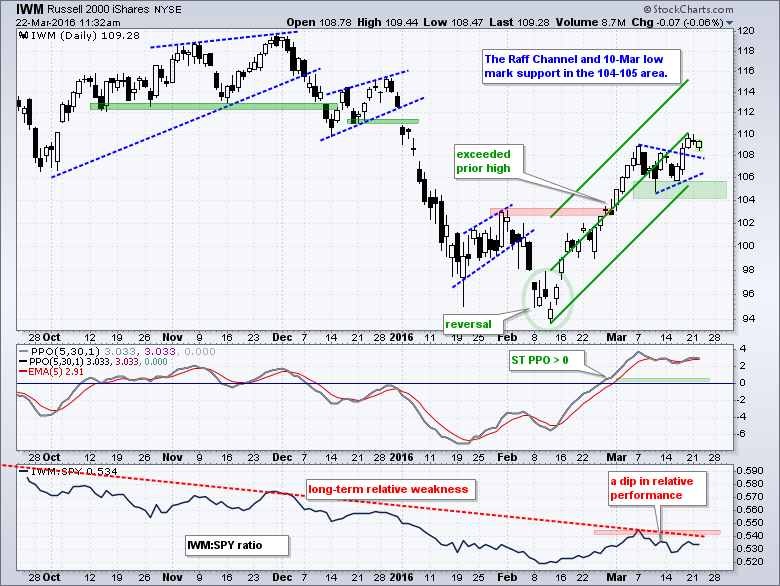
As with late October, SPY, QQQ and IWM remain in steep uptrends. In fact, these uptrends are so steep that I am continuing to use the Raff Regression Channel to define them. If you are unfamiliar with the Raff Regression Channel, there is a primer at the beginning of last week's webinar. Basically, it is a volatility-adjusted channel and the lower line helps define the uptrend. I am using this lower line, the 10-March low and a buffer to mark support zones. I think it is important to allow a little wiggle room and some space for a small pullback. A close below these support zones would reverse the current uptrends.
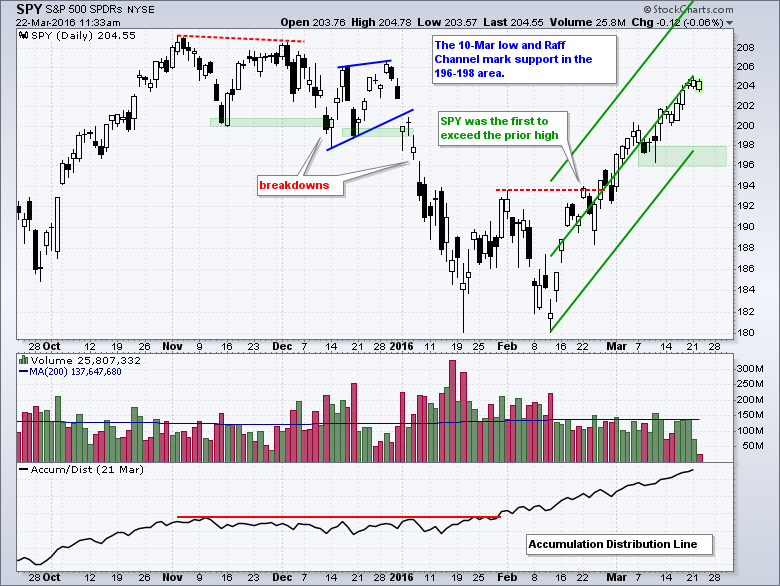
The Accumulation Distribution Line (ACDL) for SPY hit a new high for the move. This indicator is based on the level of the close relative to the high-low range. A close above the mid point shows accumulation and a close below the mid point shows distribution. Even though it seems like downside volume was strong during the January decline, the Accumulation Distribution Line did not move much and broke out at the end of January. Note: I personally do not use exchange volume or ETF volume for my analysis or trading decisions. I will, on occasion, use volume for individual stocks. Why? Because price action is much more important than volume (IMHO of course!).
The Russell 2000 iShares (IWM) was lagging a week ago, but played a little catch-up with a pennant breakout on Thursday. With a new closing high for the move, I extended the Raff Regression Channel to Friday's close. The lower trend line and pennant lows combine to mark support in the 104-105 area.
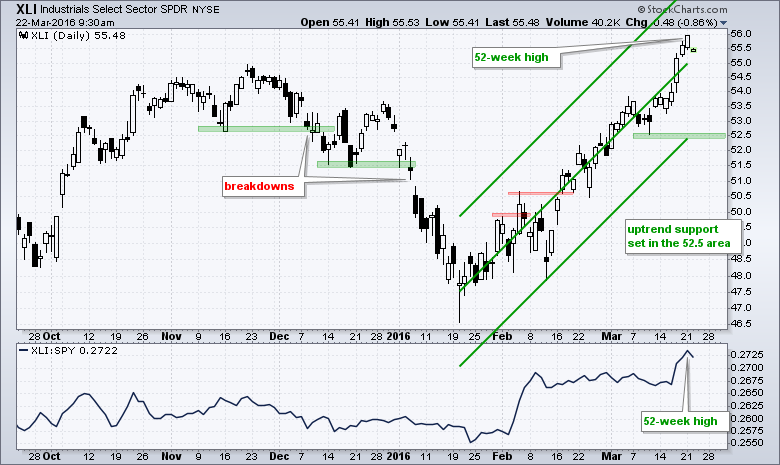
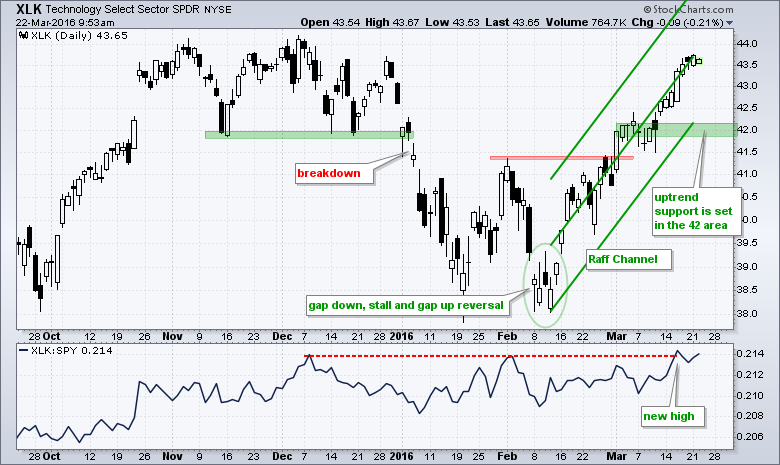
Industrials and Technology Maintain Top Position
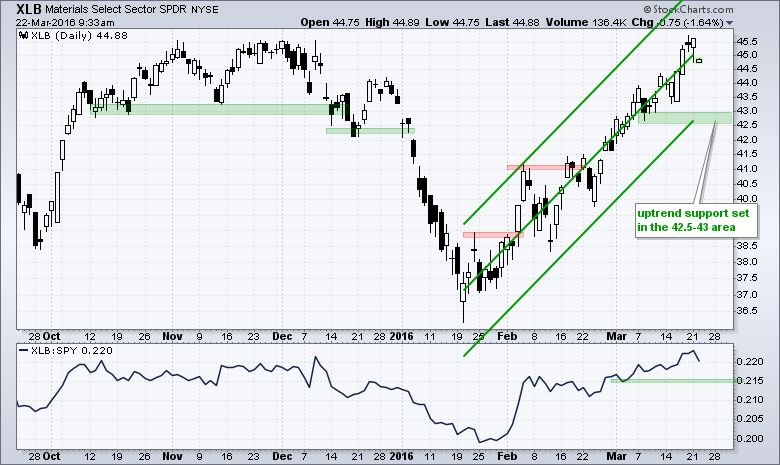
The next group of charts shows the nine sector SPDRs and they are ranked from strongest to weakest. This is not a ranking based on an indicator, but rather a subjective ranking based on price action and relative performance. Note that the Industrials SPDR (XLI) and the Technology SPDR (XLK) are at the top because they are close to 52-week highs and they led the market from mid February to now. Each chart shows the Raff Regression Channel and key support is marked with the green shading. We cannot have a downtrend in the broader market until at least five sectors break support and reverse their uptrends. Also note that six of the nine sectors are above their 200-day SMAs and all nine are above their 50-day SMAs.
The Materials SPDR (XLB) is still pretty far from a 52-week high, but it did hit a six-month high and is up the most since mid January.
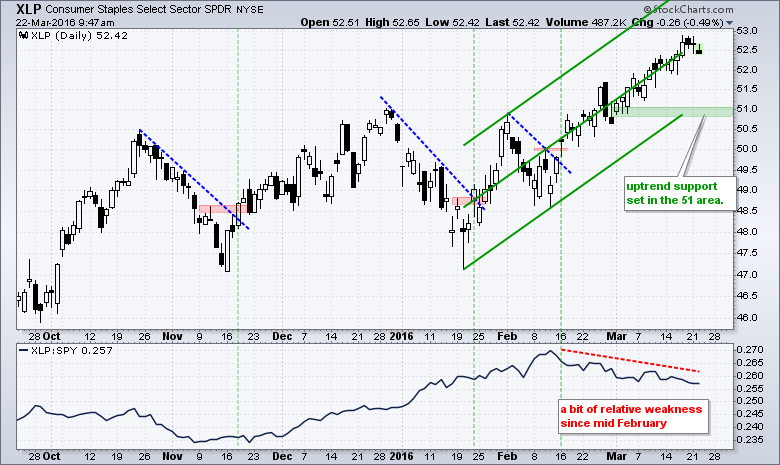
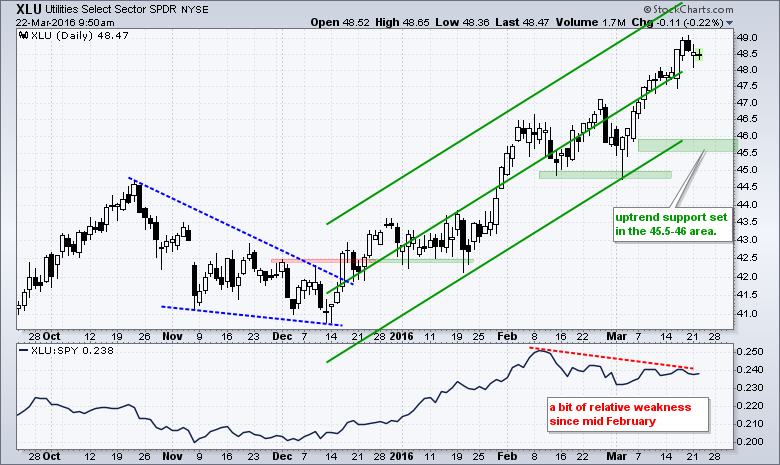
The Consumer Staples SPDR (XLP) and Utilities SPDR (XLU) were downgraded because they have underperformed since mid February. Nevertheless, they remain in strong uptrends and hit new highs recently.
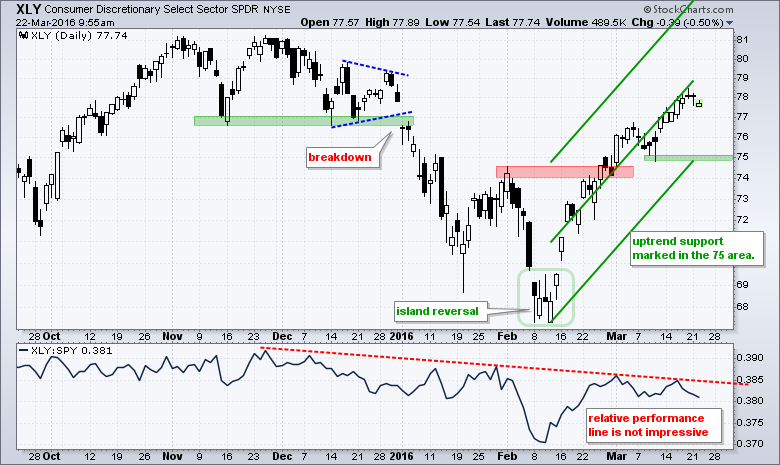
The Consumer Discretionary SPDR (XLY) is kind of the odd-ball sector right now. The ETF surged over the last six weeks, but remains well below its November high and its price relative (XLY:SPY ratio) is still falling.
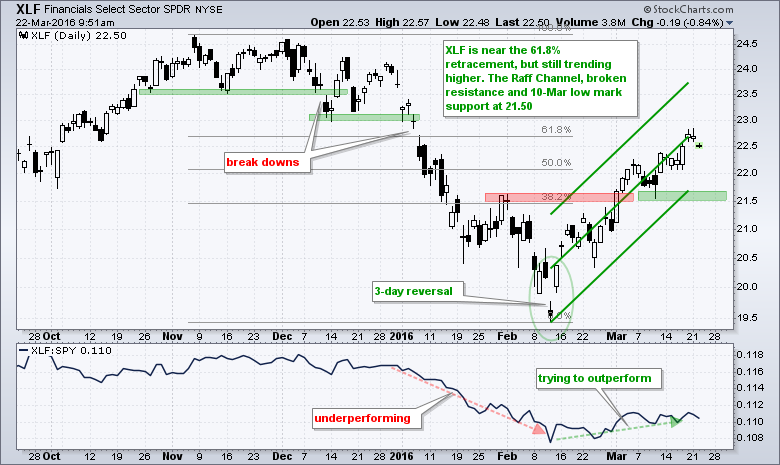
As noted in Monday's commentary, I have my eyes on the finance sector because it seems to be strengthening. A lot depends on the 10-YR Treasury Yield ($TNX) because XLF and $TNX are positively correlated.
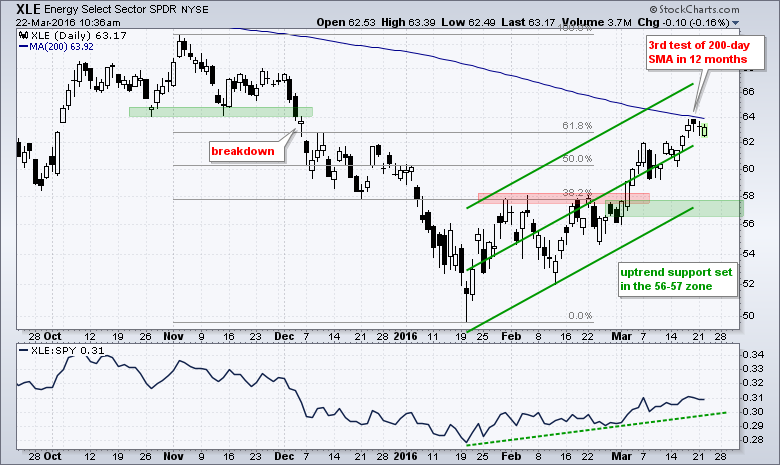
The Energy SPDR (XLE) is trading right near the falling 200-day SMA and the 61.8% retracement. Yes, this is a potential reversal zone. Even so, the immediate trend is up and we have yet to see a reversal.
Other Commentary Links
Bear Market Bounces - Understanding Bear Market Patterns, Signals and Retracements.
Measuring Risk On-Risk Off - Using charts to quantify stock, economic and credit risk.
PPO Trading Strategy - How to use 3 PPOs to develop a trend-reversion trading strategy.
Long-term Trend Indicators - Using the PPO, EMA Slope and CCI to determine the trend.
ETF Master ChartPack - 300+ ETFs organized in a Master ChartList and in individual groups.
Follow me on Twitter @arthurhill - Keep up with my 140 character commentaries.
****************************************
Thanks for tuning in and have a good day!
--Arthur Hill CMT
Plan your Trade and Trade your Plan
*****************************************


