Turning Year-to-date Positive // Breakouts are Holding, Not Folding // Risk Appetite Remains Healthy // S&P 500 Leads New High Expansion // New Highs Increase for Techs and Industrials // Getting Close to More 52-week Highs // XLI Exceeds November High // Metals & Mining SPDR Hits Retracement Zone // Friday Food for Thought ////
Turning Year-to-date Positive
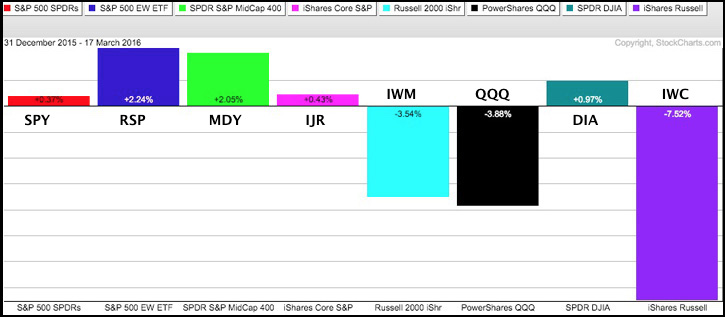
The February reversal turned into a little March madness as stocks continued higher. On a monthly basis, the S&P 500 SPDR was down around 5% in January, flat in February and up over 5% in March (month-to-date). The PerfChart below shows SPY turning positive year-to-date, along with the S&P MidCap SPDR (MDY), EW S&P 500 ETF (RSP) and S&P SmallCap iShares (IJR). That's pretty good company. Notice that MDY and RSP are leading SPY and this shows a little relative strength in mid-caps. The Russell 2000 iShares, Nasdaq 100 ETF and Russell MicroCap iShares (IWC) are down year-to-date and still underperforming overall.
Breakouts are Holding, Not Folding
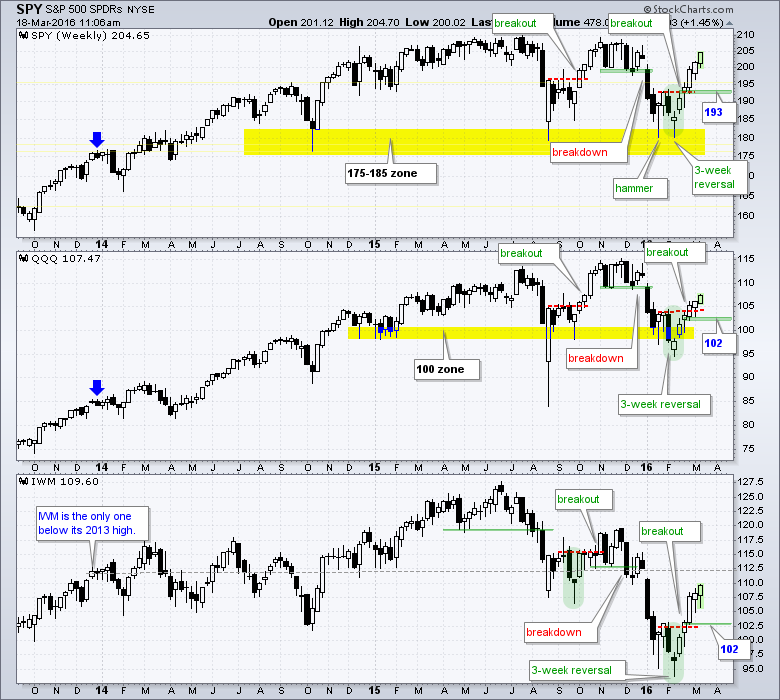
It may seem like October 2015 all over again, but that is a question for the future and I will cross that bridge when/if a top starts forming. As far as the present is concerned, I see three-candlestick reversals on the weekly charts and subsequent breakouts that amount to follow through. SPY, QQQ and IWM are holding these breakouts and these breakouts should be considered bullish until proven otherwise. The green shading marks my zone-in-the-sand and the blue numbers define the weekly closing level to watch. A weekly close below these levels would negate the breakouts and call for a reassessment. These levels are different than the levels put for on using the Raff Regression Channels on the daily charts because of the timeframe (daily versus weekly).
Risk Appetite Remains Healthy
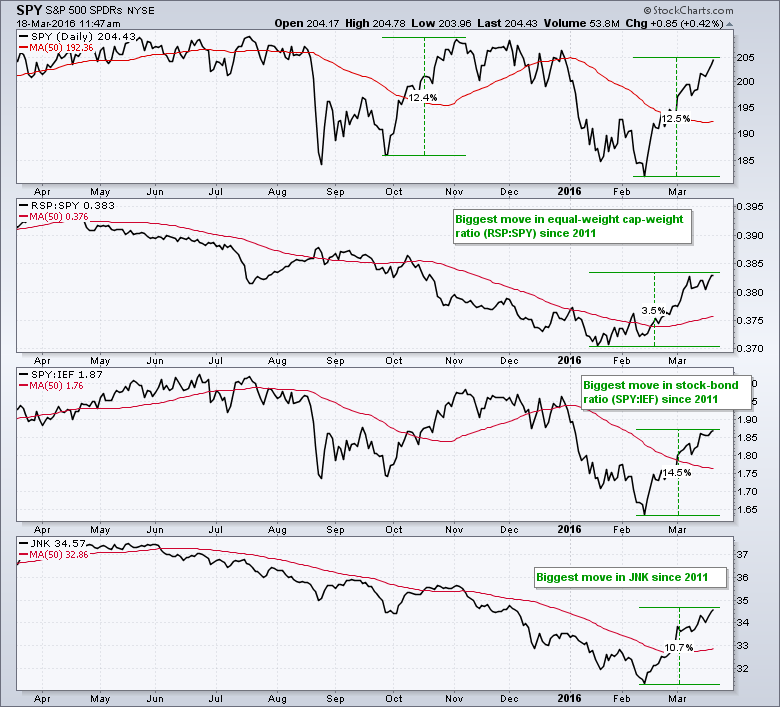
Note that I am also basing this bullish assessment on the March 3rd breadth surge and the bullish risk environment present in the stock market. Average stocks are outperforming large-caps and stocks are outperforming Treasury bonds. The EW S&P 500 ETF has been outperforming the S&P 500 SPDR since late January (RSP:SPY ratio) and the S&P 500 SPDR has been outperforming the 7-10 YR T-Bond ETF since mid February (SPY:IEF ratio). Also note that the five week Rate-of-Change for these two ratios is at its highest level since 2011. A move like this is clearly not ordinary and this strength suggests that it may have staying power. These moves also show shift towards risk-on assets and this is bullish. Elsewhere, the High Yield Bond SPDR (JNK) remains strong and the 5-week Rate-of-Change is also the highest since 2011.
S&P 500 Leads New High Expansion
S&P 500 High-Low Percent ($SPXHLP) is the first high-low indicator to turn bullish with a move above +10% (+13.8% to be exact). Once again, large-caps are leading the charge and the S&P 500 is the strongest of the major stock indices. The expansion of new highs shows that the advance is broadening and the S&P 500 is clearly in bull market mode.
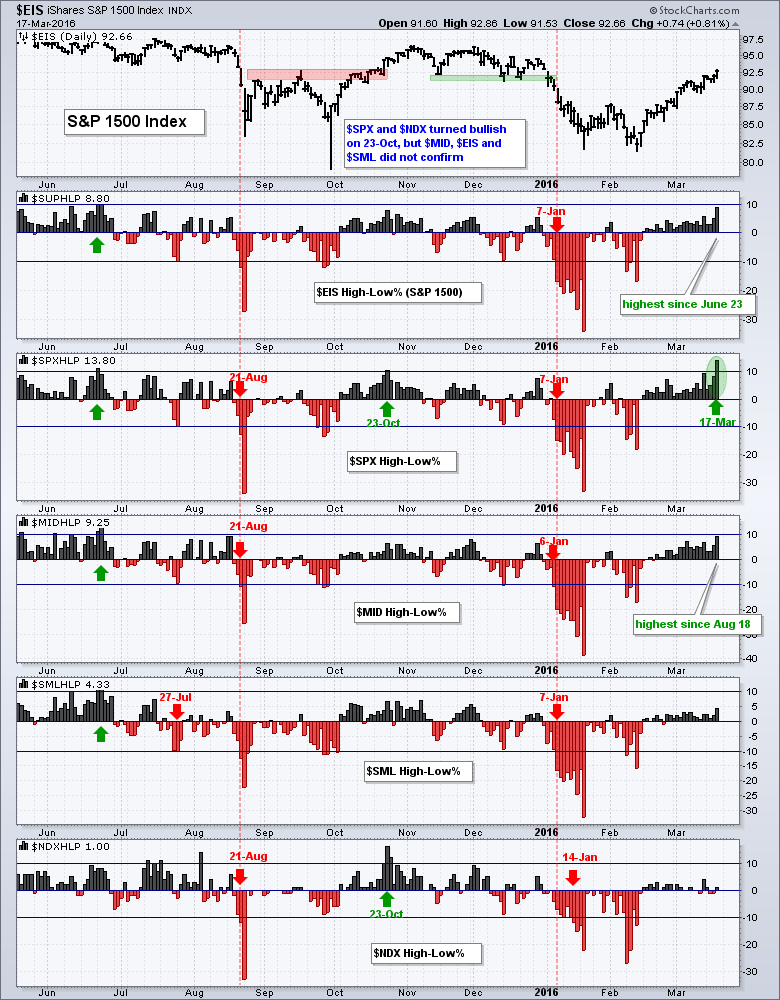
S&P 400 HiLo% ($MIDHLP) is next in line at +9.25% and S&P 1500 High-Low Percent ($SUPHLP) is close to a bullish signal at +8.80%. Note that these two indicators are at their highest levels since summer. S&P 600 HiLo% ($SMLHLP) and Nasdaq 100 HiLo% ($NDXHLP) are the weakest as both remain below +5%. In total, three of the five need to cross above +10% to put the total stock market back in bull mode. Right now we just have a large-cap bullish signal.
New Highs Increase for Techs and Industrials
The next chart shows High-Low Percent for the nine sector SPDRs and the 10-day EMA of High-Low Percent. S&P 500 High-Low Percent is at the top for reference. I set the opacity at .7 on the indicators to make the histograms a little transparent and highlight the 10-day EMA (red line). The chart is sorted by the 10-day EMA values.
Unsurprisingly, utilities and consumer staples are at the top. Utilities HiLo% ($XLUHLP) is far and away the strongest as the indicator hit +80% on Thursday and the 10-day EMA is at +40%. Third place is a bit of a surprise because Finance HiLo% ($XLFHLP) hit 18.9% and the 10-day EMA is at +6.34%. A look under the hood reveals most of the new highs coming from REITs and the rest are from the insurance group. Banks and brokers are not in the new high list and this detracts from the strong result. Nevertheless, REITs are part of the finance sector and they providing a positive influence.
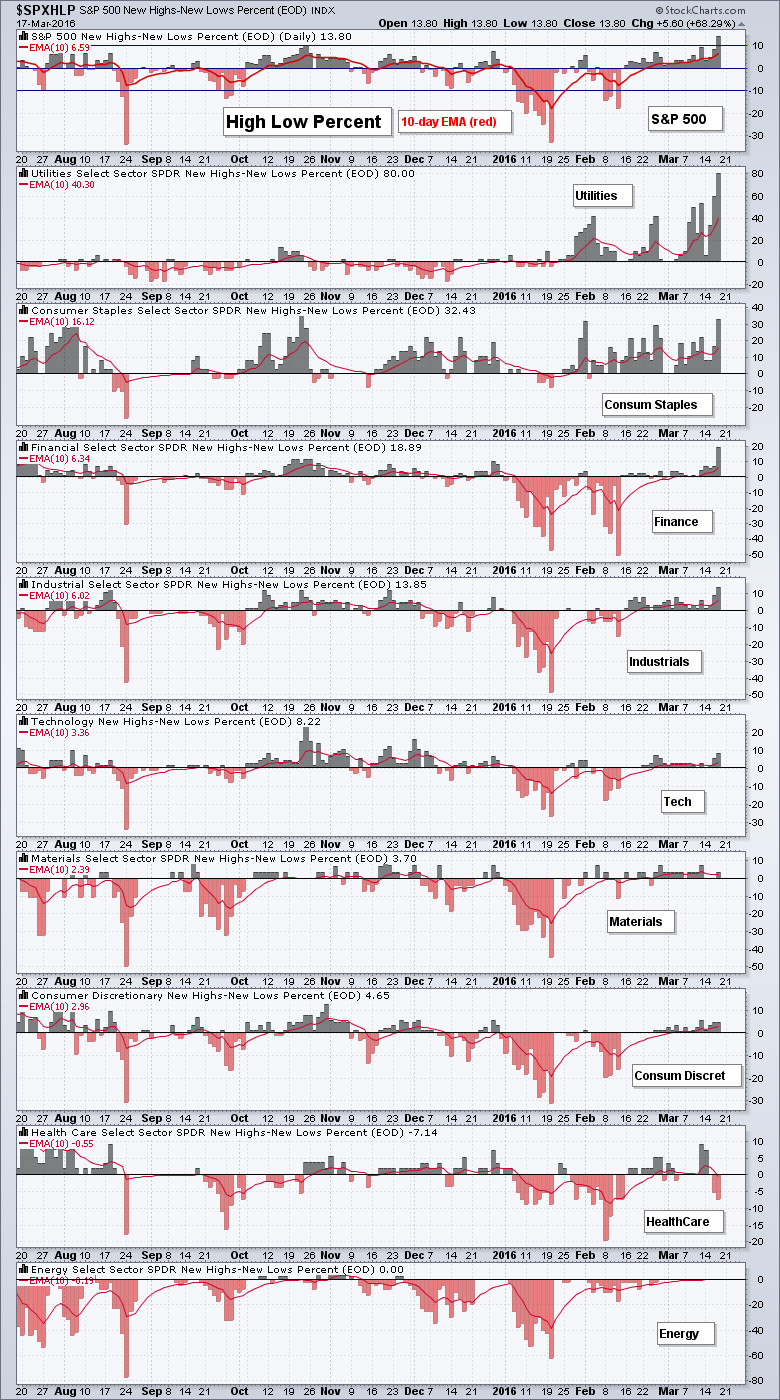
Elsewhere, Industrials HiLo% ($XLIHLP) is at its highest level since August and the 10-day EMA is above +6%. HON, MMM and WM are notable new highs. In fifth place, Technology HiLo% ($XLKHLP) hit 8.2% and its 10-day EMA is at 3.36%. Overall, I would put industrials and technology at the top of my list when scanning for stocks with bullish setups. Elsewhere, materials and consumer discretionary are net positive, but not strong enough to stand out. Healthcare and energy are still net negative.
Getting Close to 52-week Highs
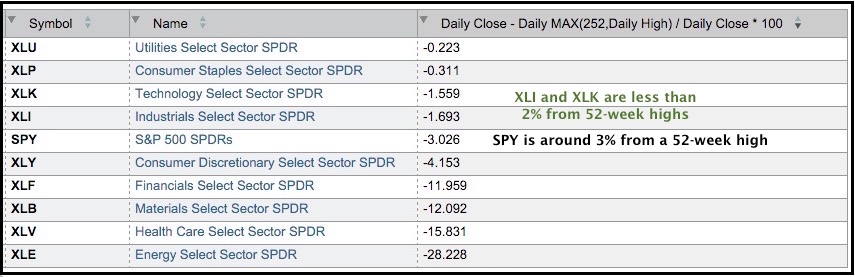
Of the nine sector SPDRs, XLI and XLK are less than 2% from 52-week highs. The 52-week high is based on the highest intraday price and the scan is based on Thursday's closing prices. Note that the Utilities SPDR (XLU) and Consumer Staples SPDR (XLP) hit 52-week highs this week. Outside of these two, I also consider XLI and XLK as strong sectors right now.
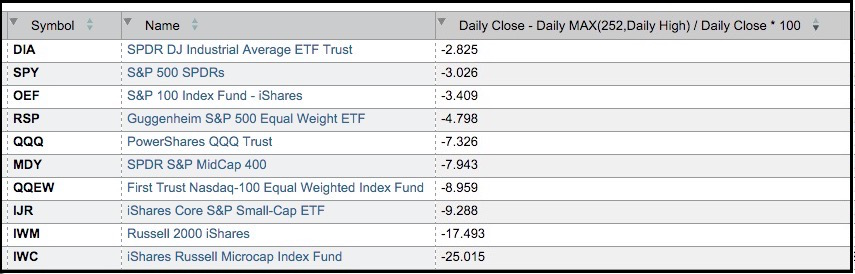
I went ahead and ran this scan for the major index ETFs and it shows large-caps in the lead. Note that DIA, SPY and OEF are the closest to 52-week highs (less than 4%). The EW S&P 500 ETF (RSP) is performing quite well and in fourth place (4.8% from a 52-week high). Small-caps are still the weakest overall. Notice that IJR is 9.2% from a 52-week high and IWM is 17.5% below its 52-week high. IWM has a higher beta and higher risk than IJR.
XLI Exceeds November High
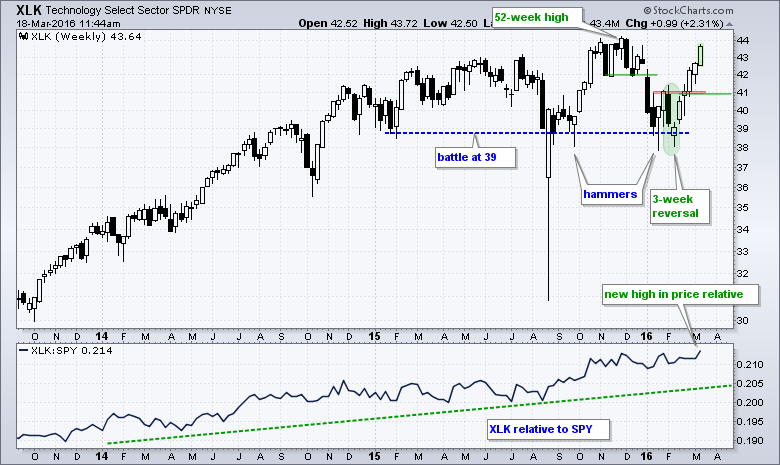
The Technology SPDR (XLK) is one of the strongest sectors because its price relative hit a new high and the late February breakout is holding. XLK formed a three-candlestick reversal in February and broke out at the end of the month. This breakout is valid as long as 41 holds on a closing basis (weekly close). The indicator window shows the price relative (XLK:SPY ratio) in a steady uptrend and hitting a new high.
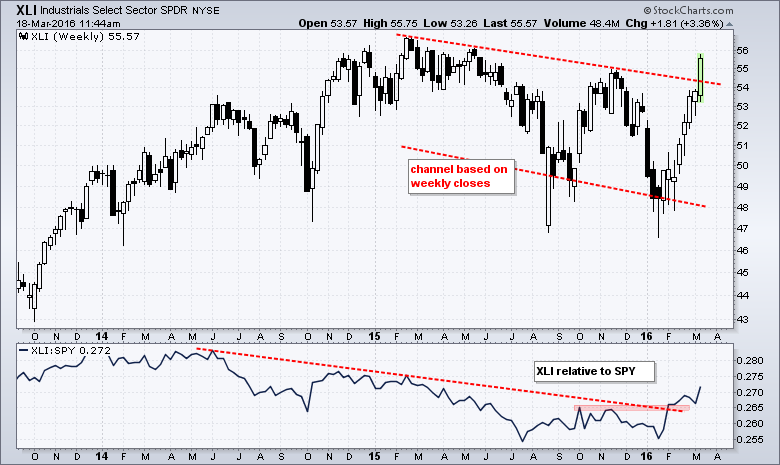
The Industrials SPDR (XLI) broke out of a falling channel and exceeded its November high. Note that XLI is up seven of the last eight weeks. The indicator window shows the price relative breaking out in late January and hitting a multi-month high this month.
Metals & Mining SPDR Hits Retracement Zone
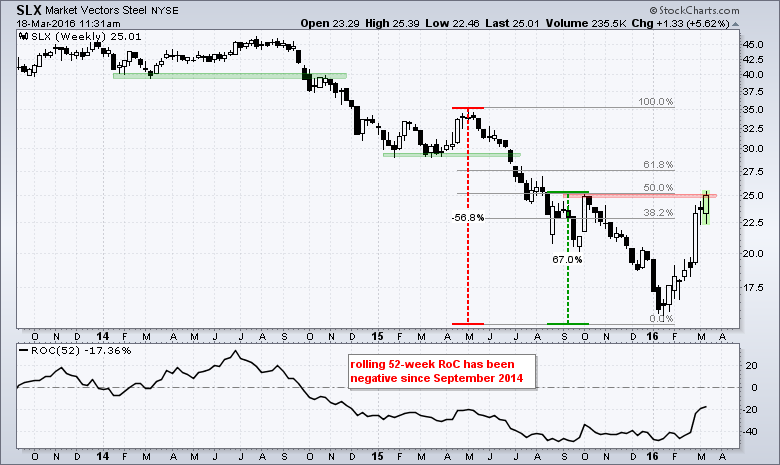
The surge in the Metals & Mining SPDR (XME) and Steel ETF (SLX) is indeed impressive when looked at over the last eight weeks. XME is up around 90% and SLX is up around 67%. Despite massive gains, both are still down double digits over the past year. Notice that the 52-week Rate-of-Change has been negative since September 2014 and is currently below -15%.
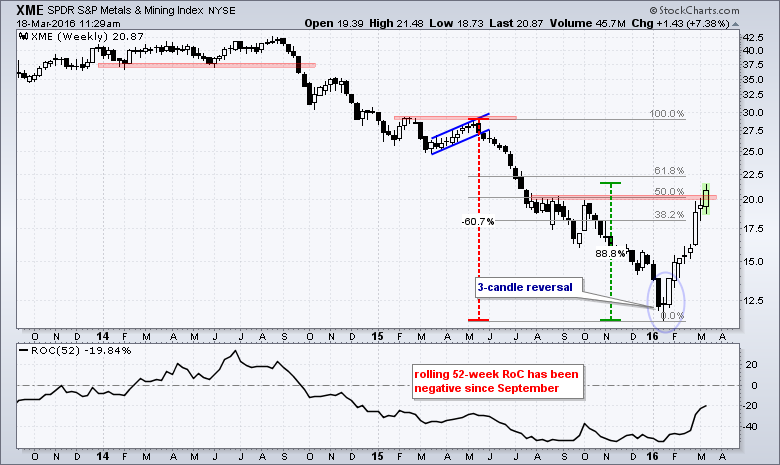
The eight week surge could indeed mark a major low, but I am more inclined to wait for the pullback. Buying now would be like forcing a three point shot with a hand in your face. This is usually not the best opportunity - unless, of course, you are Stephen Curry. Notice that both ETFs are trading in the 50-62% retracement zones and quite extended. A pullback is not guaranteed just because they are in a potential reversal zone, but a pullback is probable in the coming weeks. There will be a pullback at some point and I am willing to wait for a setup. There is no shot clock for entering a position!
Friday Food for Thought
Politics, Investing, and the Rules of the Game (Justin Sibears, Newfound Research)
Diversification depends on finding asset classes with diverse behavior. Tracking error constraints limit the ability to take advantage of this behavior and so often require a trade-off between benchmark tracking and risk-adjusted performance.
What You Don’t Want To Hear About Dividend Stocks (Meb Faber)
I was hoping to find a strategy that might approximate the returns of a dividend strategy as a starting point. As it turns out, by focusing on value and avoiding or eliminating dividends entirely, we were already miles ahead. But it was about to get better…
Trading Notes For The Week Of March 14, 2016 (Dr. Brett Steenbarger, TraderFeed)
Price action following a catalytic event provides us with important information. This is especially true when we see a change in the distribution of transactions following a news event or other catalyst. Increased volume and a new skew of volume lifting offers versus hitting bids, for example, tells us that fresh buying flows have come into the market. This calls for an updating of our views of the stock or index.
The Conference - Investment Strategy (Jeffrey Saut, Raymond James)
As I look back on my long career, the most successful companies create customer loyalty, as opposed to holding their customers hostage. And I believe that technology now enables people to go around (or over) moats faster than ever before.
Don’t Be Fooled by a Bear-Market Rally in Stocks (Mark Hulbert, CBS MarketWatch)
If you want to know what a bear-market rally in stocks looks like, the past month has been a sterling example. That’s because rallies as sharp as we’ve seen since the Feb. 11 lows are hardly unusual, even when the major trend is down.
Other Commentary Links
Bear Market Bounces - Understanding Bear Market Patterns, Signals and Retracements.
Measuring Risk On-Risk Off - Using charts to quantify stock, economic and credit risk.
PPO Trading Strategy - How to use 3 PPOs to develop a trend-reversion trading strategy.
Long-term Trend Indicators - Using the PPO, EMA Slope and CCI to determine the trend.
ETF Master ChartPack - 300+ ETFs organized in a Master ChartList and in individual groups.
Follow me on Twitter @arthurhill - Keep up with my 140 character commentaries.
****************************************
Thanks for tuning in and have a good day!
--Arthur Hill CMT
Plan your Trade and Trade your Plan
*****************************************


