SPY Leads Market Higher // The One-Two Breadth Punch // Surging within a Big Range // Marking a Reversal Zone for a Pullback // Healthcare Breaks Down as Finance Stalls // Gold and Silver Affirm Support Levels // Crude Holds Double Bottom Breakout ////
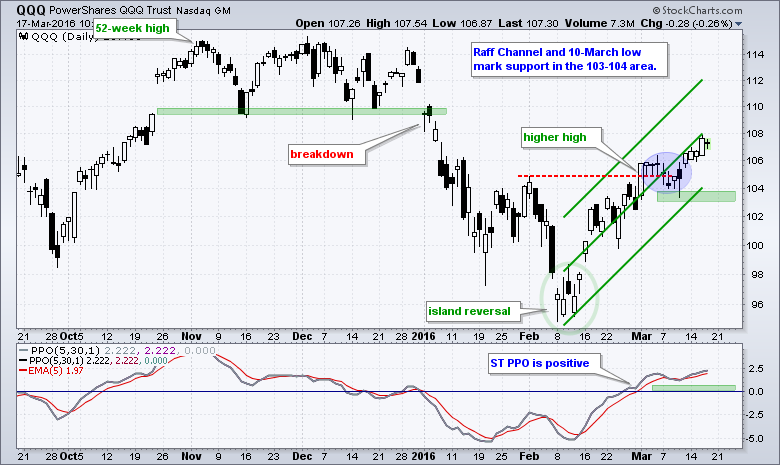
QQQ led the big three with the biggest gain on Wednesday and the ETF hit a new high for the move, which began in mid February. The advance is now 23 days long and shows no signs of letting up. There was a small consolidation after the March 1st breakout (blue area) and then a little breakout continuation on Friday. I removed the Fibonacci Retracements Tool for greater focus on the immediate trend, which is up. The Raff Regression Channel and 10-Mar low mark support in the 103-104 area. Note that I extended the Raff Regression Channel to Wednesday's close because it marks the highest close of the current move.
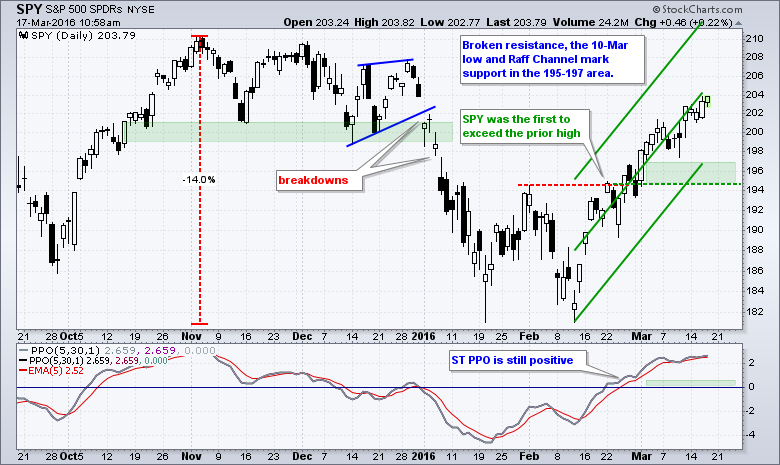
SPY was the first to exceed its prior peak and is the strongest in March, but it is still up a little less than IWM and QQQ over the last 23 trading days (mid February low). Nevertheless, SPY is the only one trading above its January support break and it is the closest to a 52-week high (less than 4%). It is tempting to raise support to 197, but I am going to leave key support at the 195-197 area for now. This is a strong uptrend and I would view pullbacks as opportunities instead of threats.
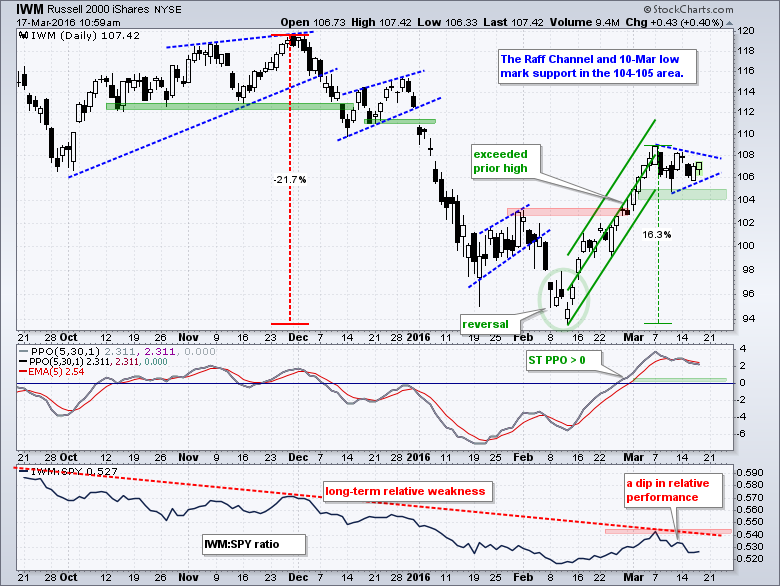
 IWM showed a little relative weakness the last seven days, but a bullish pennant is taking shape. Note that the ETF surged around 16% in 16 days and is entitled to a rest. The pennant is a continuation pattern, the prior move was up and this makes it a bullish continuation pattern. A breakout at 108 would signal a continuation higher. The Raff Regression Channel, 10-Mar low and a buffer mark key support in the 104-105 area.
The One-Two Breadth Punch
There was a breadth thrust signal on March 3rd and the immediate trends are up, but I see a big trading range on the long-term S&P 500 chart and High-Low Percent has yet to confirm the breadth thrust. A bullish breadth thrust occurs when the 10-day EMA of S&P 1500 AD Percent ($SUPADP) surges above +30% and S&P 1500 High-Low Percent ($SUPHLP) turns bullish with a move above +10%. The breadth thrust shows strong buying pressure that can signal the start of an uptrend. Strength in High-Low Percent shows that the advance is broadening and getting critical mass. This is the one-two breadth punch required for a bull market environment.
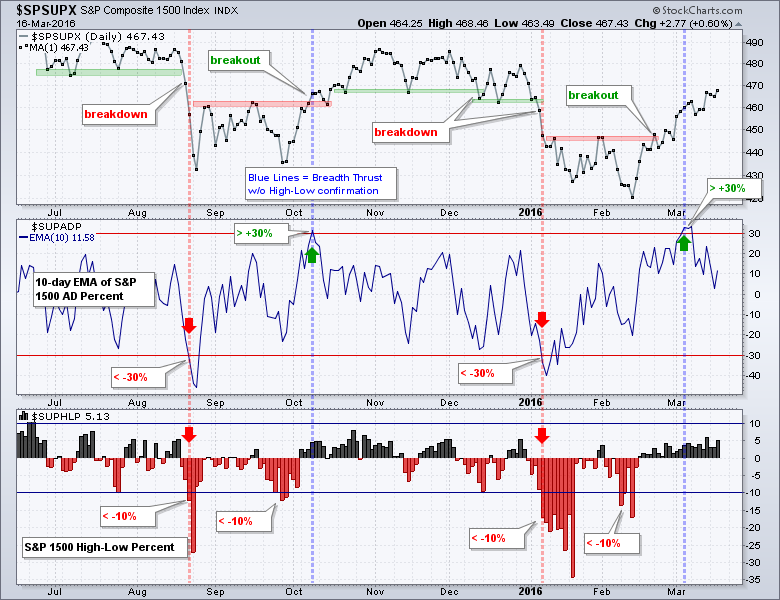 As the chart above shows, there is only one bullish signal active right now and this suggests that the broad market environment is neither bullish nor bearish. Admittedly, it is like the twilight zone because we do not know if the sun is rising or setting. Note that High-Low Percent did not turn bullish in October either. Nevertheless, I think the market cup is half full (bullish) until this breadth thrust is negated or we see trend reversals on the charts above.
Surging within a Big Range
We can compare the last two surges with the current surge on the next chart, which shows the S&P 500 over the last eighteen months. The index has traded between 1830 and 2133, and is currently in the top half of this range. The index surged 11.7% in 36 days in Oct-Nov 2014 and 12.3% in 26 days in Oct-Nov 2015. The current surge is around 11% in 23 days. Nobody knows how long or far this advance will extend, but the odds favor a pullback within the next two weeks. The red shading marks the pullbacks in December 2014 and November 2015. They were quite sharp.
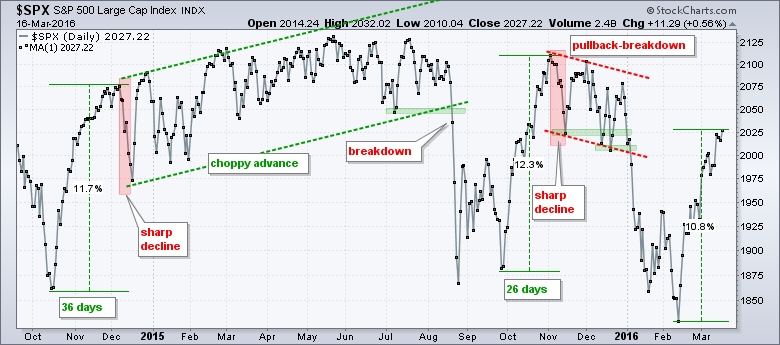
Now let's look at post-pullback price action for clues on what may happen now. After the sharp pullback in December 2014, the S&P 500 recovered immediately and hit new highs before yearend. The index then embarked on a choppy advance that lasted until July. The S&P 500 also bounced after the sharp pullback in November 2015, but did not exceed its prior high. Instead, the index formed lower highs and broke down in mid December and early January.
There was a one-two bullish breadth punch in October 2014 and this is probably why the index embarked on a choppy advance until July 2015. The surge had critical mass as new highs expanded. There was a bullish breadth thrust in October 2015, but High-Low Percent did not confirm. The advance did not broaden enough and this is why it ultimately failed. Thus, I am waiting for High-Low Percent to exceed +10% before calling this a bull market again.
Marking a Reversal Zone for a Pullback
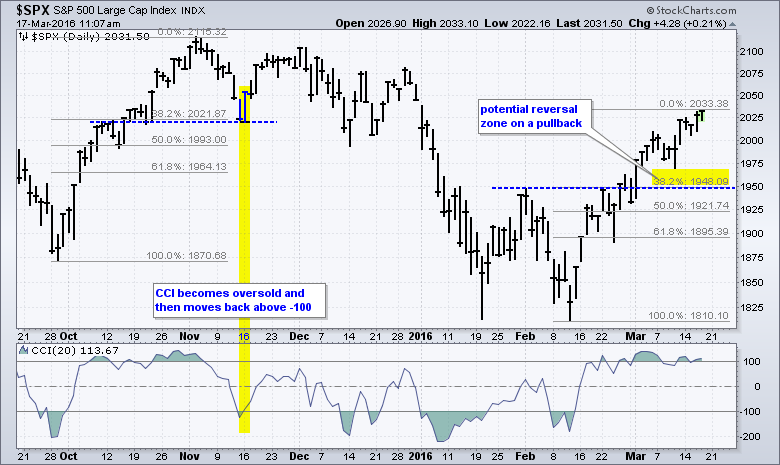
The S&P 500 is the most watched of the major stock indexes and it is the most widely used benchmark for the stock market. Even though it is weighted by market-cap and may not be representative of the market as a whole, it is the single best index to watch for clues on the stock market. At this point, I would look for a bullish reversal after a pullback into the 1950-1970 zone. Notice that broken resistance turns support at 1950 and a 38.2% retracement of the Feb-Mar surge would extend to 1948. I would also look for CCI to become oversold with a move below -100. A subsequent move back above -100 would suggest that prices are bouncing again.
 The S&P 500 should be watched closely because 80+ percent of the stock market moves in line with the S&P 500. Thus, is the S&P 500 pulls back to the 1960 area (-3.5%), we can expect most stock ETFs and stocks to also pullback. If the S&P 500 reverses in the 1950-1970 zone and bounces, we can expect 80+ percent of ETFs and stocks to bounce as well. Thus, traders should be on their toes if/when the S&P 500 pulls back to the 1960 area.
Healthcare Breaks Down as Finance Stalls
As noted in Tuesday's webinar, the stock market is in good shape as long as three of the big five sectors hold support levels marked on the charts below (a simple majority). The key sectors are consumer discretionary, technology, finance, industrials and healthcare. Healthcare is breaking down today and finance shows relative weakness, but the majority remain above support and in clear uptrends that support the broad market uptrend.
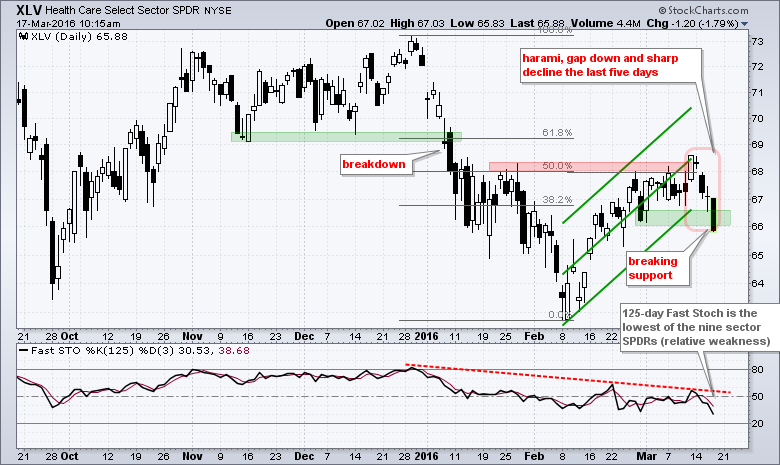
The HealthCare SPDR (XLV) is by far the weakest of the five as it broke support with a sharp decline on Thursday. The 125-day Fast Stochastic Oscillator moved to 30 and this is the lowest reading of the nine sectors. XLV already showed relative weakness and now it is breaking down.
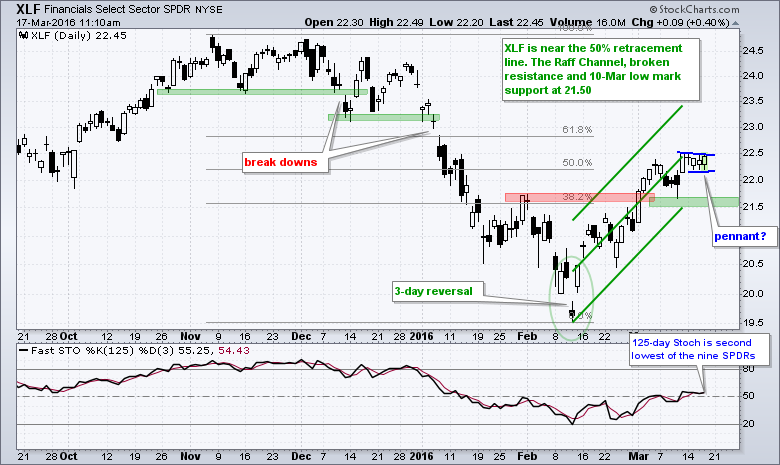
 The Finance SPDR (XLF) stalled the last four days, but the overall trend remains up and it has yet to breakdown. The Raff Regression Channel and 10-Mar low mark support in the 21.5-21.7 area. The ETF shows relative weakness because the 125-day Fast Stochastic Oscillator is at 52, which is the second lowest reading of the nine. Short-term, XLF stalled with a small pennant and this is the first pattern to watch. A break above 22.5 would be bullish and argue for further gains in this key sector.
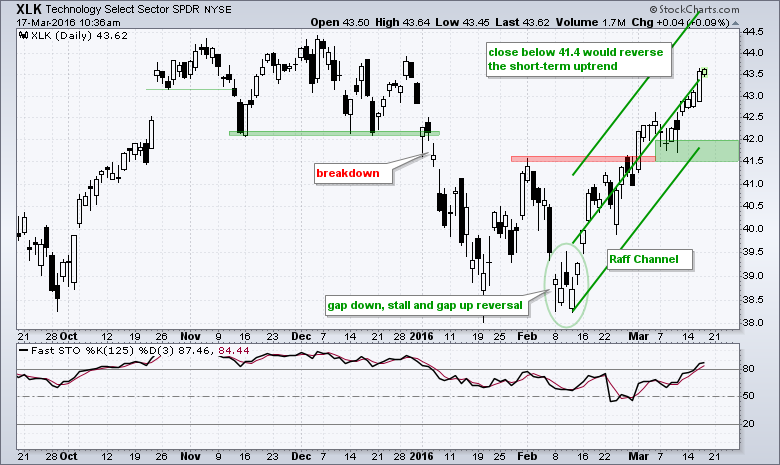
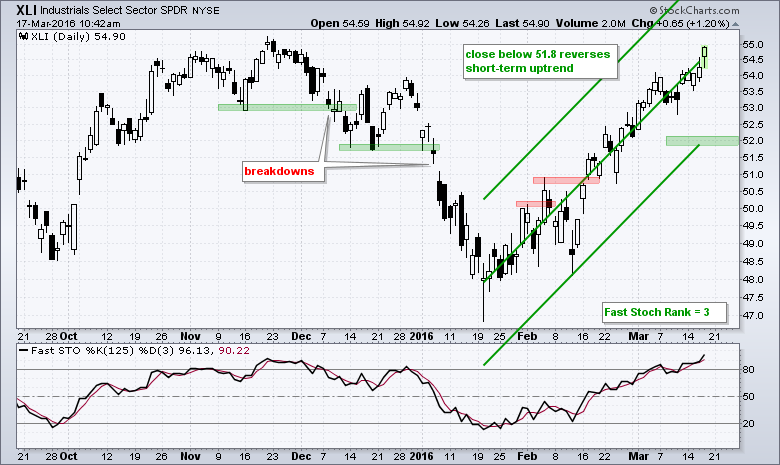
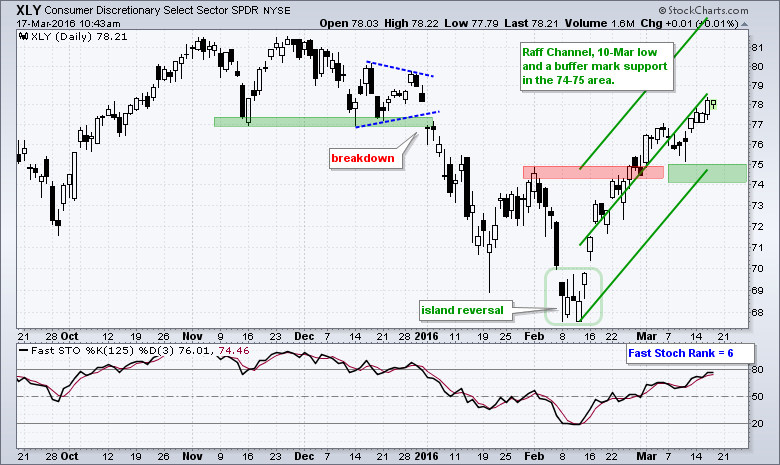
 The next three charts show support updates for the Technology SPDR (XLK), Industrials SPDR (XLI) and Consumer Discretionary SPDR (XLY).
Precious Metals Extend Breakouts
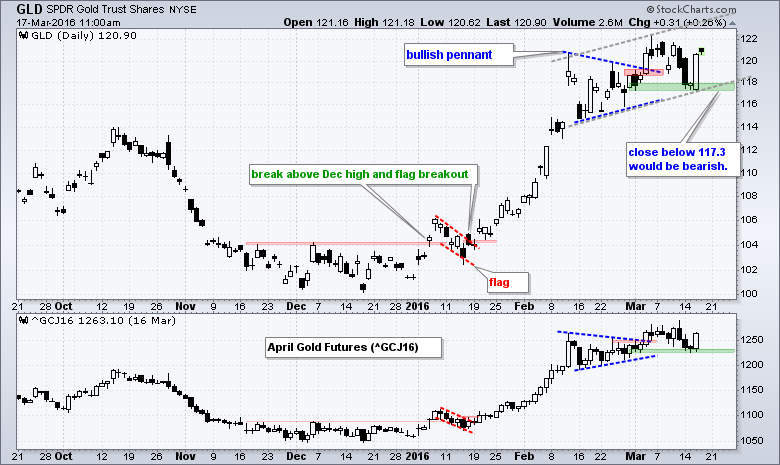
I highlighted bullish continuation patterns in gold, platinum and silver last week, and all three extended higher after their breakouts. The Gold SPDR (GLD) fell back to the middle of its pennant and surged with a move above 120. This bounce reinforces support in the 117.3-118 area and a close below 117.3 would be bearish. Instead of a pullback or correction after a sharp advance, we sometimes see a choppy advance unfold as a slowing uptrend emerges. The gray trend lines mark this possibility.
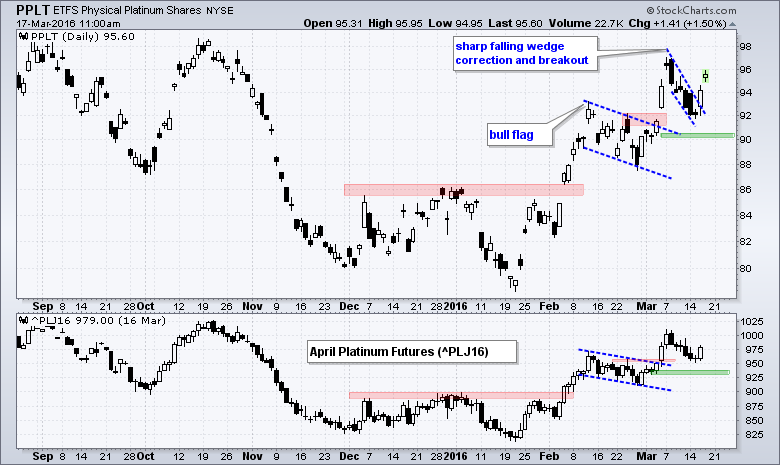
 The Platinum ETF (PPLT) pulled back with a sharp falling wedge and broke the wedge trend line with a surge. The bigger flag breakout held and this wedge breakout is bullish. I will leave support at 190 for now.
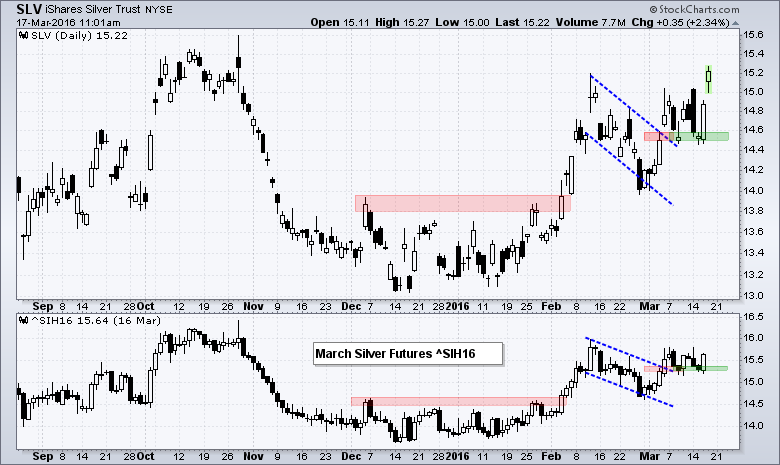
 The Silver ETF (SLV) also broke out with a surge in early March and then turned choppy. The breakout zone around 14.5-14.6 ultimately held as the ETF surged off the 14.50 area. A close below 14.50 would negate this breakout.
Crude Holds Double Bottom Breakout
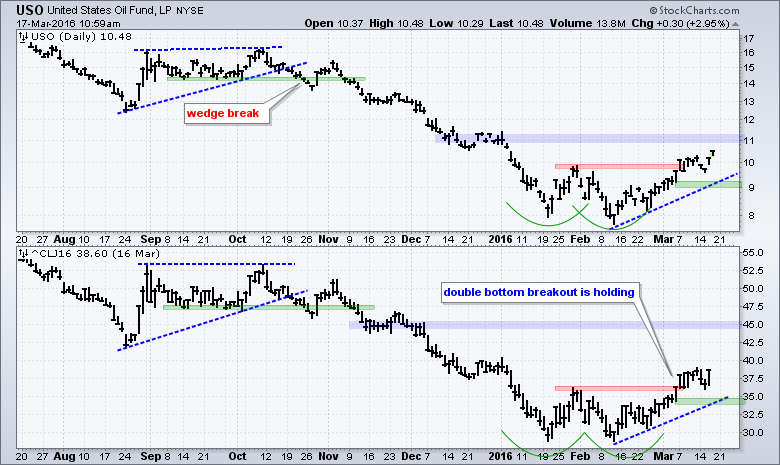
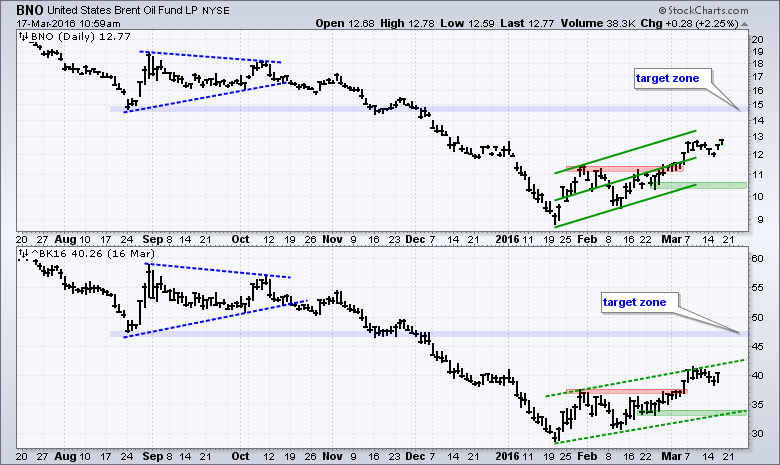
Oil broke out with a surge in early March and this breakout is largely holding. There is no sense thinking bear as long as support levels hold. Note that continued strength in oil is positive for junk bonds and stocks. The bottom window shows April Crude (^CLJ16) with two lows around 29 and a breakout around 36.5. Prices stalled after the breakout, but it held for the most part and remains bullish. I am marking support at 34 for April crude and at 9 for USO. The second chart shows Brent Futures with a rising channel and support marked at 32.5.
Other Commentary Links
Bear Market Bounces - Understanding Bear Market Patterns, Signals and Retracements.
Measuring Risk On-Risk Off - Using charts to quantify stock, economic and credit risk.
PPO Trading Strategy - How to use 3 PPOs to develop a trend-reversion trading strategy.
Long-term Trend Indicators - Using the PPO, EMA Slope and CCI to determine the trend.
ETF Master ChartPack - 300+ ETFs organized in a Master ChartList and in individual groups.
Follow me on Twitter @arthurhill - Keep up with my 140 character commentaries.
****************************************
Thanks for tuning in and have a good day!
--Arthur Hill CMT
Plan your Trade and Trade your Plan
*****************************************


