The Biotech iShares (IBB) is one of the weakest industry group ETFs and the HealthCare SPDR (XLV) is one of the weakest sector SPDRs right now. Amgen is part of both and the stock broke down with a sharp decline the last two days. The price chart shows AMGN with its first break down in early January. The stock bounced with a rising flag and broke down again in early February. A triangle then formed and the stock broke triangle support on Wednesday, March 9th. This break down signals a continuation of the 2016 downtrend.
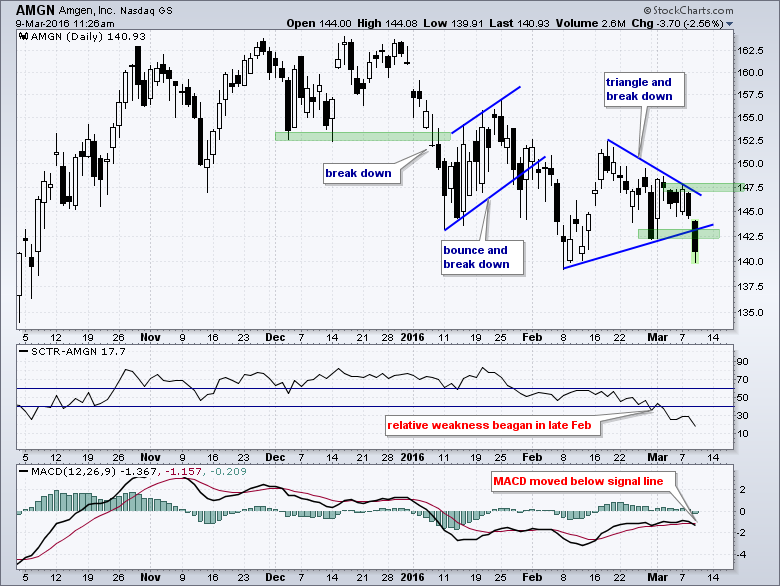
The first indicator window shows the StockCharts Technical Rank (SCTR), which is a relative performance ranking that ranges from zero to one hundred. AMGN was holding up relatively well until late January when the SCTR moved below 40 for the first time since October. Note that the stock market in general was weak from January to mid February. AMGN held up during this weakness, but did not bounce with the market in late February and early March. Momentum is also turning down again as MACD moves below its signal line.
****************************************
Thanks for tuning in and have a good day!
--Arthur Hill CMT
Plan your Trade and Trade your Plan
*****************************************


