S&P 500 Battles 2K // Majority of Stocks above 200-day // Short-term Uptrends Hold // Watching Bonds and Yields Closely // Gold and the Yen // Three High and Tight Flags in Tech Sector // Stock Setups and Breakouts // CA, CSCO, DTLK, MSFT, ABBV and FRGI // //
S&P 500 Battles 2K
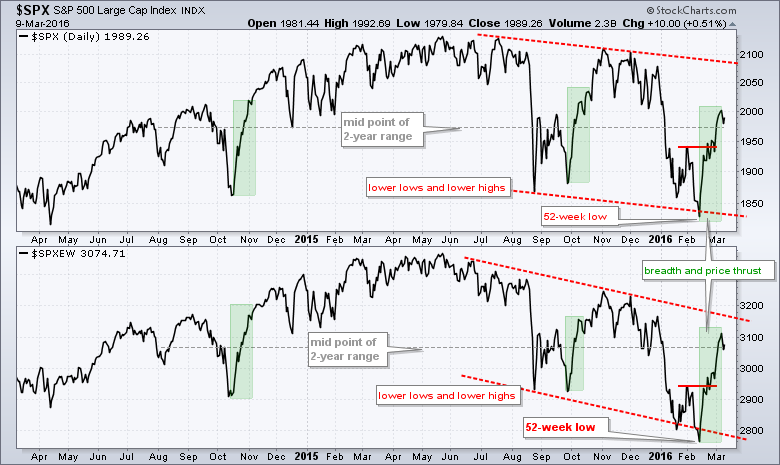
There is no real change in the overall market situation. The S&P 500 is trading in the middle of its two year range and battling the 2000 area for the umpteenth time since September 2014. There is something in the market for both bulls and bears right now. The February breadth thrust is bullish, but we have yet to see the High-Low Percent indicators turn bullish for a follow thru signal. The S&P 500 broke above its prior peak with the February surge, but this bounce started from a 52-week low. At this point, I am short-term bullish because the short-term trends are up and the short-term indicators are bullish. I am long-term neutral because the bullish breadth thrust negated the bear market signal and we have yet to get a follow through signal with the High-Low Percent indicators. High-Low Percent for the S&P 1500 needs to clear +10% to turn bullish and I will update this chart on Friday.
Majority of Stocks above 200-day
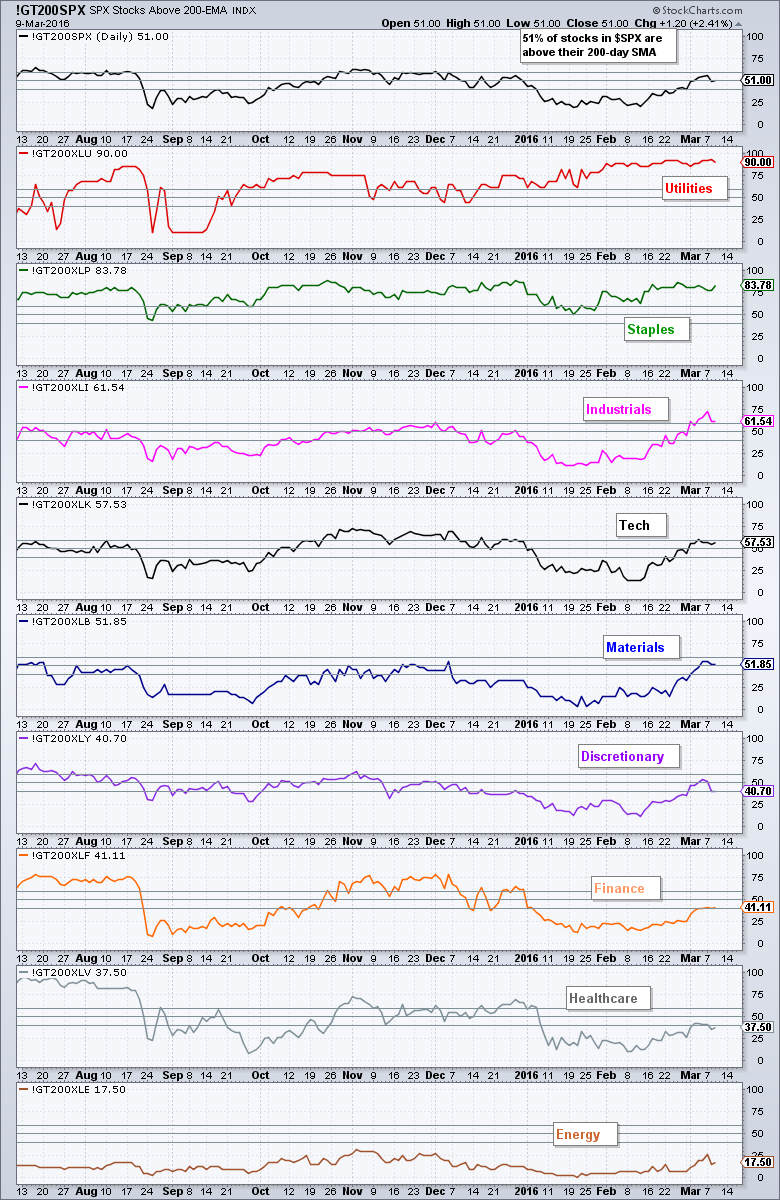
Overall, I am seeing more positives than negatives in the market. Even though we have yet to see a serious expansion of new highs, new highs have outpaced new lows in March. The percentage of stocks above the 200-day moving average is above 50% for five of the nine sectors (XLB, XLK, XLI, XLP, XLU). This is a simple majority. In addition, these five sectors account for exactly 50% of the S&P 500 and 51% of the stocks in the S&P 500 are above their 200-day moving average. This is a push at the very least. And finally, the Russell 2000 iShares (IWM), EW S&P 500 ETF (RSP) and Retail SPDR (XRT) are leading the market this year. There are pockets of weakness and negativity, but it ain't all negative.
Short-term Uptrends Hold
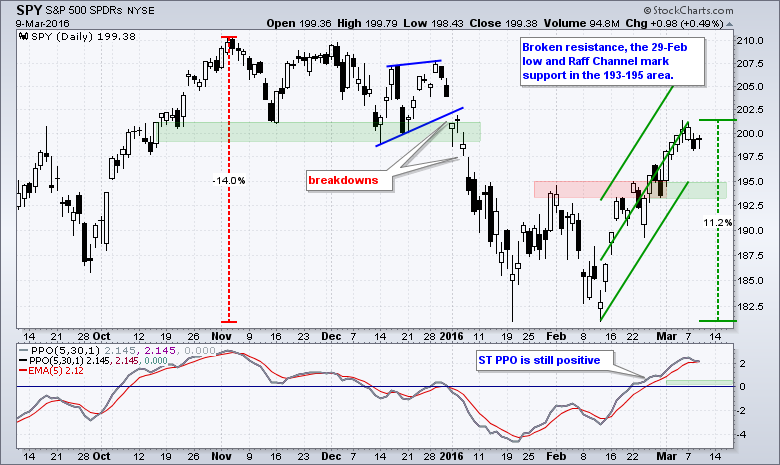
SPY, QQQ and IWM remain in short-term uptrends that are quite steep. All three were up double digits from mid February to early March and they are entitled to a rest, which could involve a pullback or consolidation. I think the advances are too steep for normal trend lines so I am going to use the Raff Regression Channel to help define these short-term uptrends. The middle line of a Raff Regression Channel is a linear regression, which is a line of best fit for the closing prices. The outer lines are equidistant from the furthest high or low from the linear regression. This means the outer lines account for a little volatility. I am really only interested in the lower line because it can be used to define the uptrend. A close below this lower line would show weakness and could herald a short-term trend reversal. On the SPY chart, the lower line, the 29-Feb low and broken resistance combine to mark support in the 193-195 area.
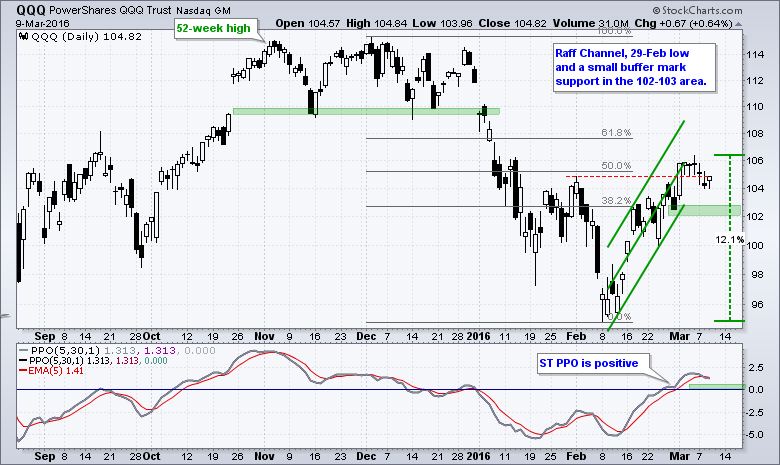
QQQ is the weakest of the three right now. It had the shortest advance (12.1%) and it is still struggling to hold above the 1-Feb high (red line). Blame it on biotechs. After the long white candlestick and break out on March 1st, the ETF has traded between 104 and 106 with several indecisive candlesticks. Notice that the open and close are pretty much equal the last six days. The short-term trend, however, is clearly up and I am marking support in the 102-103 area.
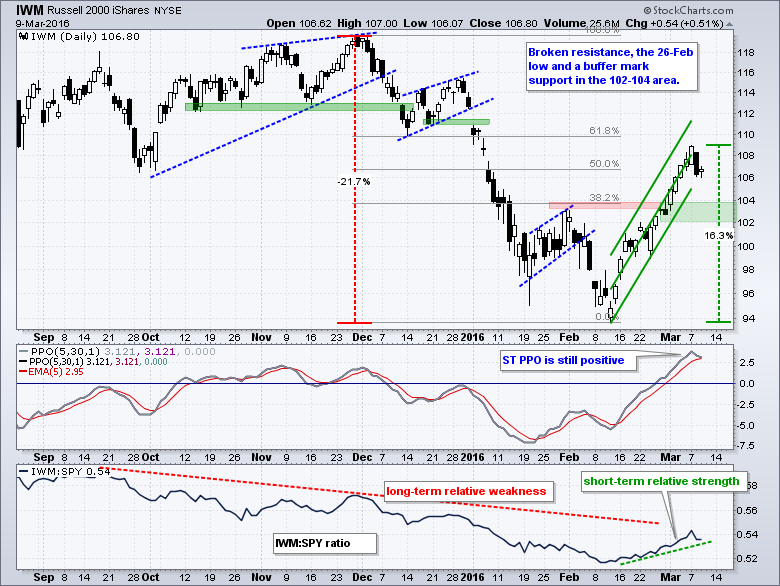
IWM is the strongest of the three since mid February because it has the highest Rate-of-Change (+16.3%). The Raff Regression Channel is also the tightest and the steepest. I could based support on the lower line and mark support at 105, but I want to allow for a little wiggle room and will leave support in the 102-104 area for now.
Watching Bonds and Yields Closely
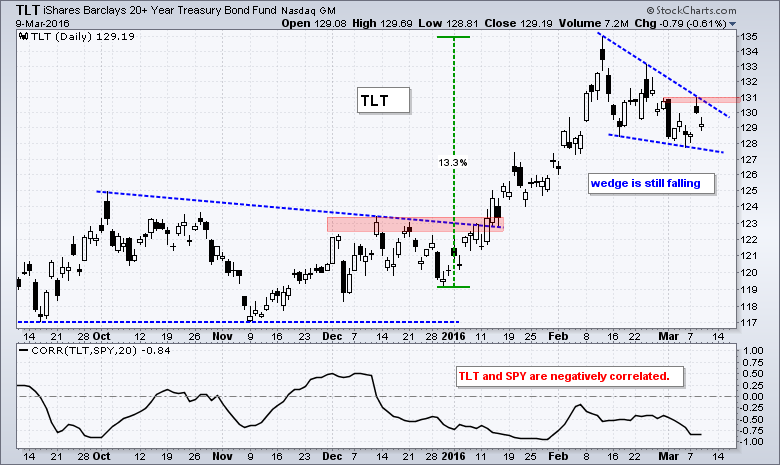
The short-term trend is still down for the 20+ YR T-Bond ETF (TLT) and this is favorable for stocks. Yes, the decline looks like a falling wedge and this could be a mere correction, but the trend is down as long as the wedge falls. A close above 131 would break wedge resistance and reverse this downtrend. Such a move would be negative for stocks because TLT and SPY are negatively correlated.
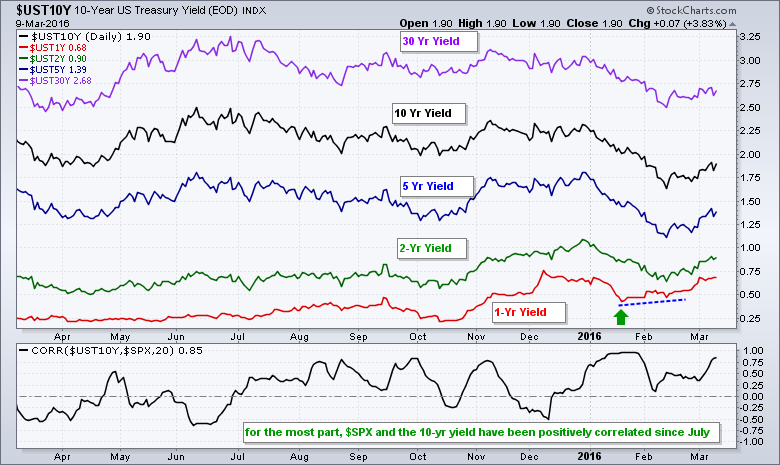
I am also noticing strength at the short end of the yield curve. The chart below shows five different Treasury yields (from 1 year to 30 years). The 1-year Treasury Yield ($UST1Y) hit a multi-year high in early December, fell back in early January and bottomed in mid January (green arrow). The 2-year Treasury Yield ($UST2Y) bottomed in mid February and has been moving higher the last four weeks. This seems to be positive for stocks so let's see if it holds.
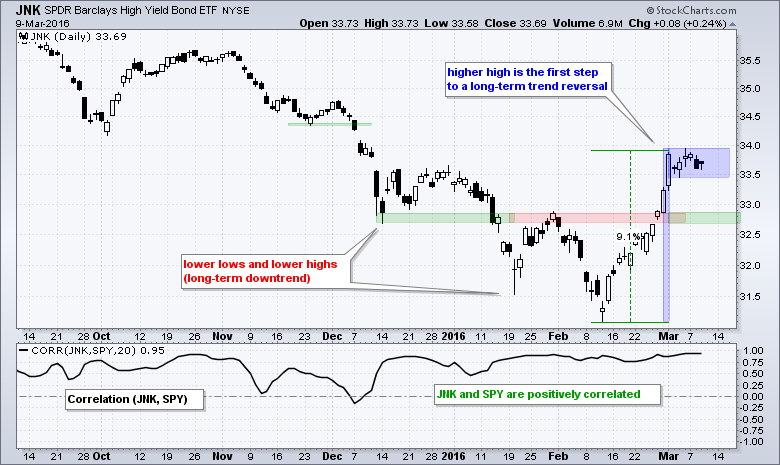
There is no change in the High Yield Bond SPDR (JNK) has it extends its stall to six days. This stall may be some sort of high and tight flag, and a break above 34 would signal a continuation higher. Such a move would be quite positive for stocks because JNK and SPY have a strong positive correlation. A pullback is also possible so a break below 33.4 would be short-term negative and this would weigh on stocks.
Gold and the Yen
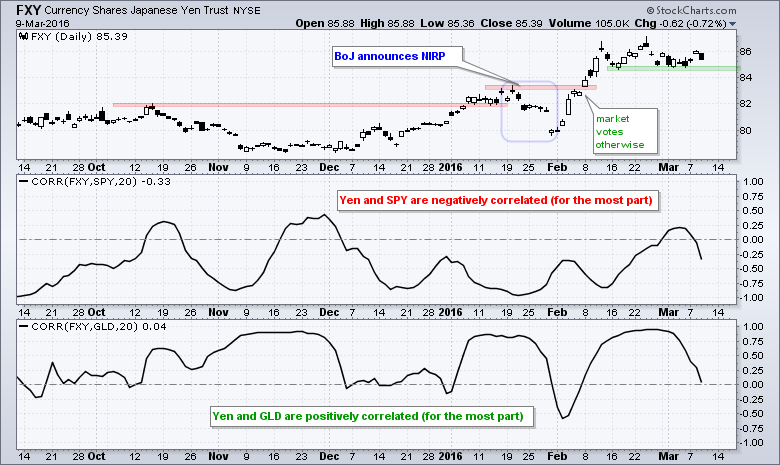
Even though stocks surged from mid February to early March, the Yen ETF (FXY) simply moved sideways and did not break support. This is a bit unexpected because the Yen is a risk-off asset and it should decline when risk assets rise. That may happen today. Notice that FXY and SPY are mostly positively correlated, while FXY and GLD are mostly negatively correlated. A support break in the Yen, therefore, would be positive for stocks and negative for gold.
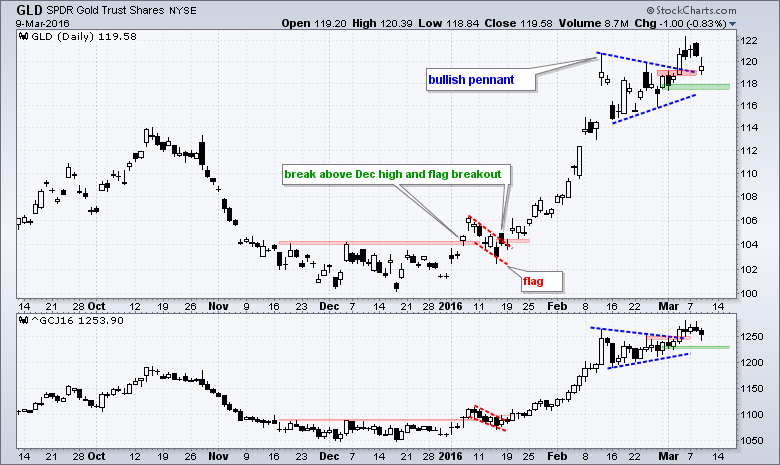
The Gold SPDR (GLD) fell back on Wednesday, but the pennant breakout is still there and the overall trend is up. A close below 117.3 would negate the pennant breakout and call for a re-evaluation.
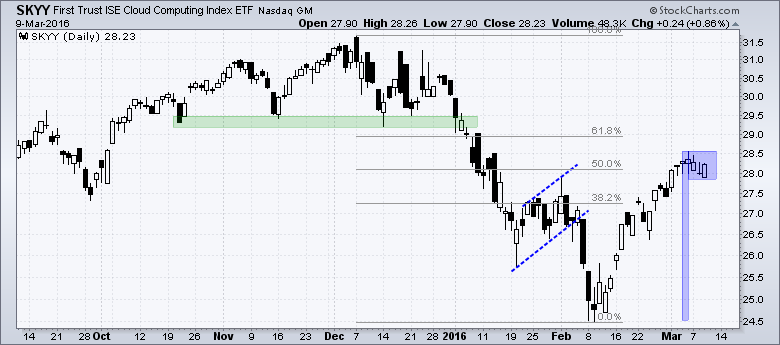
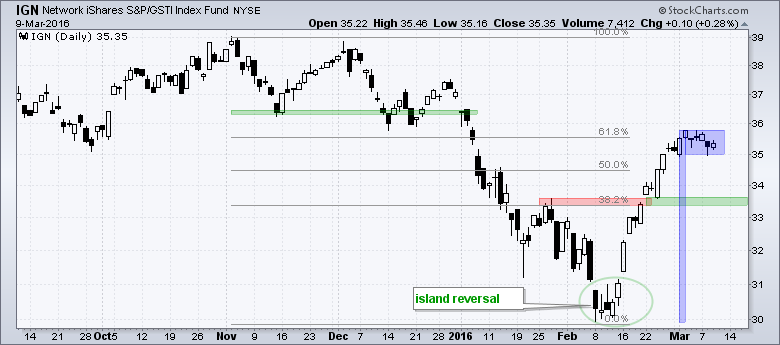
Three High and Tight Flags in Tech Sector
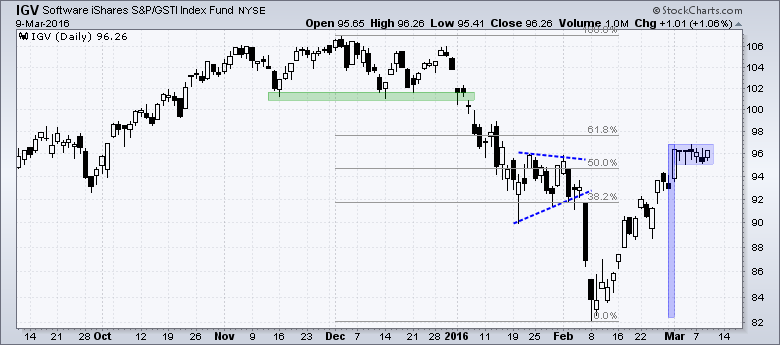
I realize that high and tight flags are very short-term patterns, but I am only seeing short-term setups after the sharp advance from mid February to early March. The next three charts come from the technology sector. Flag breakouts would be bullish and signal a continuation of the prior advance. Notice that all three forged 52-week lows in February and the current advance reached the 50-62% retracement zone. These could be just big counter-trend advances, but notice that all three exceeded their 1-Feb highs. It is a tough call so I will watch the flag boundaries for the next direction clue.
Stock Setups and Breakouts
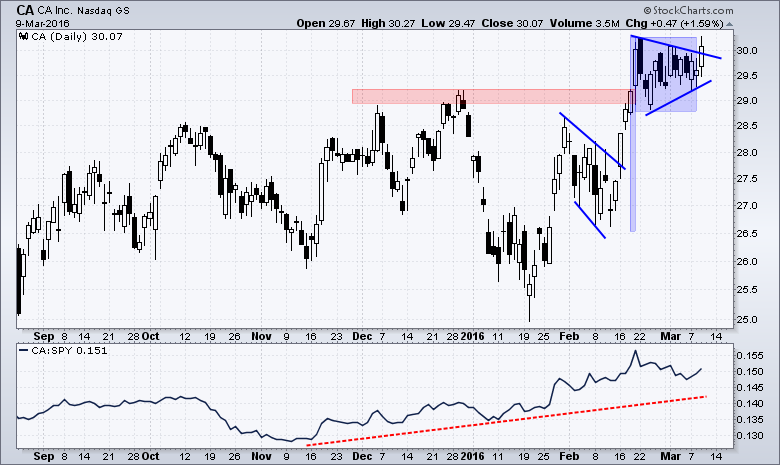
CA broke out with a surge in February, consolidated with a pennant and broke the upper trend line on Wednesday. The indicator window shows the price relative (CA:SPY ratio) with a steady rise since mid November. CA is outperforming SPY and sports a strong price chart.
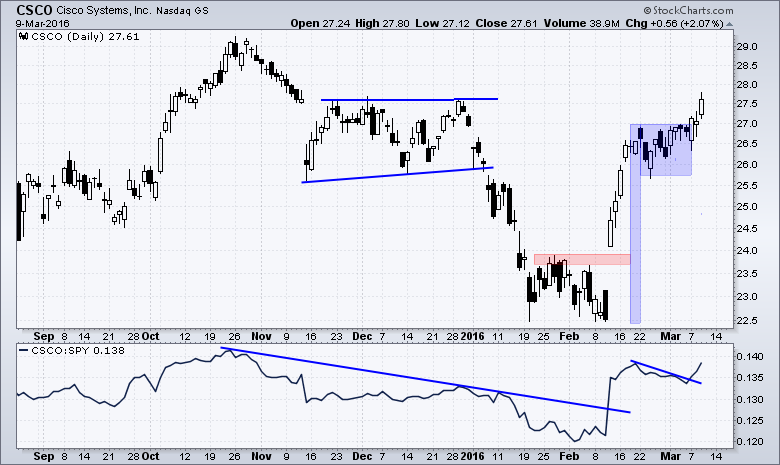
CSCO is showing upside leadership and powering the Networking iShares (IGN). The stock gapped up and surged 20% in February. A choppy consolidation then took shape and the stock broke above its mid February high on Monday. The price relative also turned back up as CSCO outperformed the last few days.
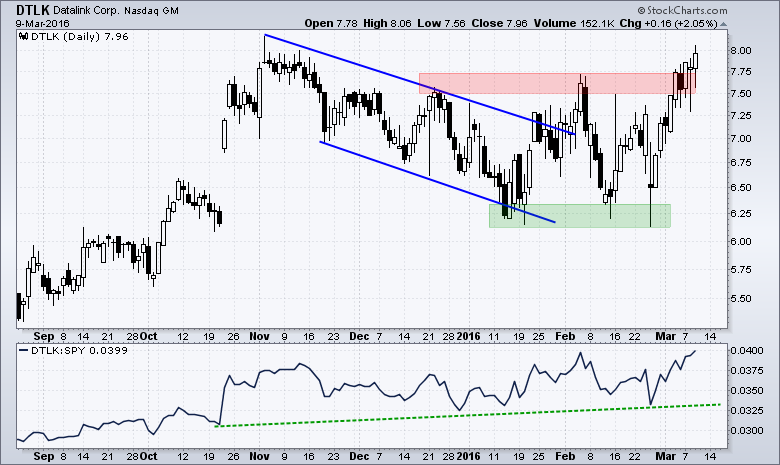
DTLK is a risk low-priced stock, but it sure is acting well this year. The stock bounced off the 6.25 level three times and broke out with a surge the last two weeks. The price relative (DTLK:SPY ratio) has been in an uptrend for over six months.
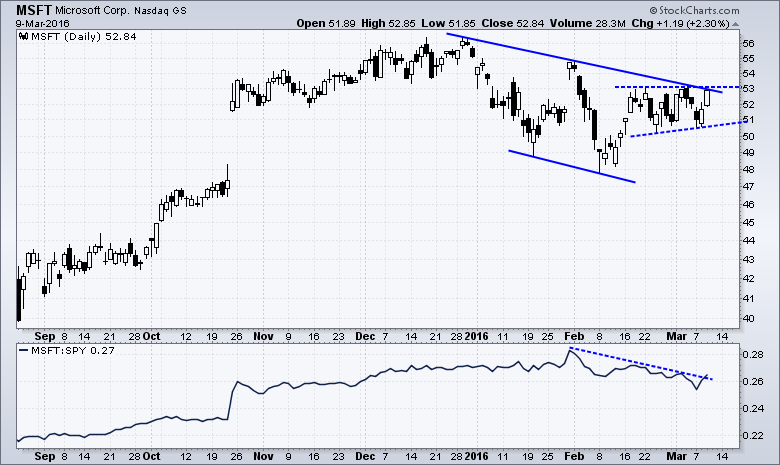
MSFT made a move the last two days and is on the verge of breaking the channel trend line and the upper trend line of a small ascending triangle.
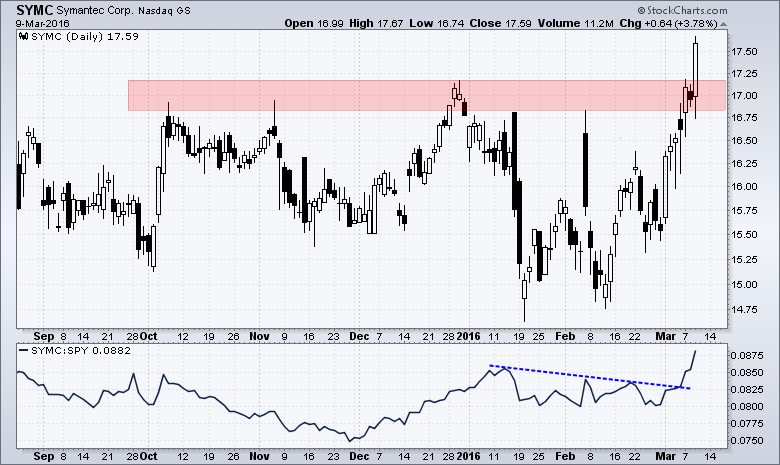
SYMC is short-term overextended, but it is one to put on the radar with a big breakout on the price chart and with the price relative.
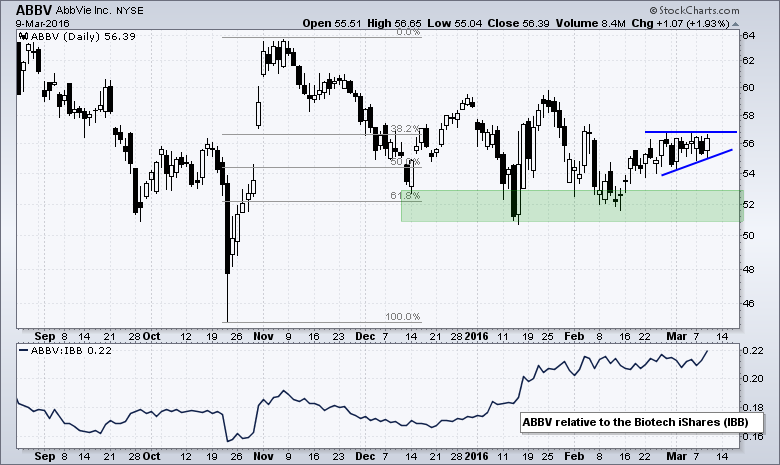
Many big biotechs were down on Wednesday, but AbbVie (ABBV) bucked the selling pressure and scored a small gain. The stock bounced off the 52 area three times and formed a small ascending triangle the last three weeks. Look for a break above 57 to turn bullish.
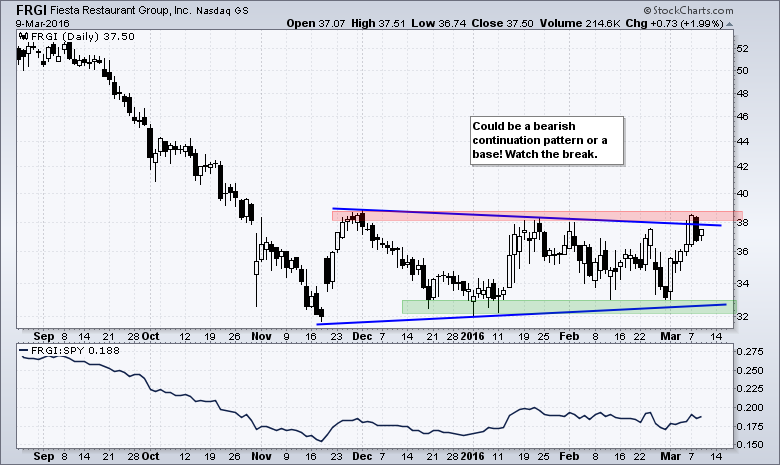
FRGI formed a large consolidation over the last four months that is either a base or a bearish continuation pattern. The stock surged to resistance in March and a break above the red zone would be bullish.
Other Commentary Links
Bear Market Bounces - Understanding Bear Market Patterns, Signals and Retracements.
Measuring Risk On-Risk Off - Using charts to quantify stock, economic and credit risk.
PPO Trading Strategy - How to use 3 PPOs to develop a trend-reversion trading strategy.
Long-term Trend Indicators - Using the PPO, EMA Slope and CCI to determine the trend.
ETF Master ChartPack - 300+ ETFs organized in a Master ChartList and in individual groups.
Follow me on Twitter @arthurhill - Keep up with my 140 character commentaries.
****************************************
Thanks for tuning in and have a good day!
--Arthur Hill CMT
Plan your Trade and Trade your Plan
*****************************************


