The Great Debate Rages // SPY Maintains Short-term Uptrend // QQQ Sputters // IWM Continues to Lead // Bond Trends Favor Stocks // April Crude Breaks Prior High // Gold, Platinum and Silver Hold Breakouts // Ranking the Sectors on 6-month Performance // XLU and XLP Still Leading // XLF and XLV Lagging // Webinar Preview ////
The Great Debate Rages
The surge over the last few weeks sparked a big debate on the current status of the stock market. Is this a bear market rally or is this the start of another bull run? Perhaps it is neither! The chart below shows the $SPX near the 2000 level and just above the mid point of its two year range. The index first crossed 2000 in August 2014 and has been virtually flat since then. Of course, there were some pretty big swings during this "trading" range.
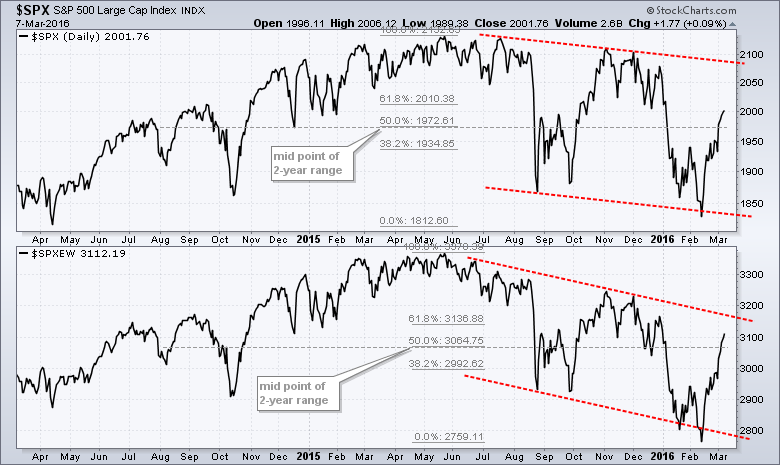
The S&P 500 Equal-Weight Index ($SPXEW) is also just above the mid point of its two year range, but below the high from September 2014. There is an argument to be made that the trend since summer is down because both formed lower highs in November and lower lows in February. There is also an argument to be made that the surge over the last few weeks was a game changing event. Note that small-caps led, breadth was strong and industrial commodities rebounded sharply. At this stage, I think the surge over the last three weeks was too broad to be ignored and I am more inclined to buy the dips than predict the tops.
SPY Maintains Short-term Uptrend
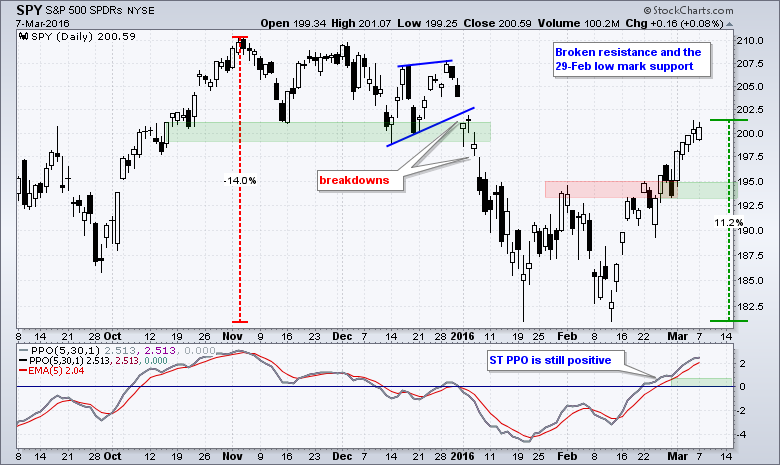
There is no change in the short-term trends: they remain up and extended. SPY is up around 11% in 16 trading days and the short-term PPO (5,30,1) remains above its 5-day EMA. I would use broken resistance and the 29-Feb low to mark support in the 193-195 area. The PPO has been above its 5-day EMA for 14 days, which is the longest streak since October. Notice that the PPO held above its signal line for 24 days in October and moved above 3 as SPY became overbought and stayed overbought in October.
QQQ Sputters
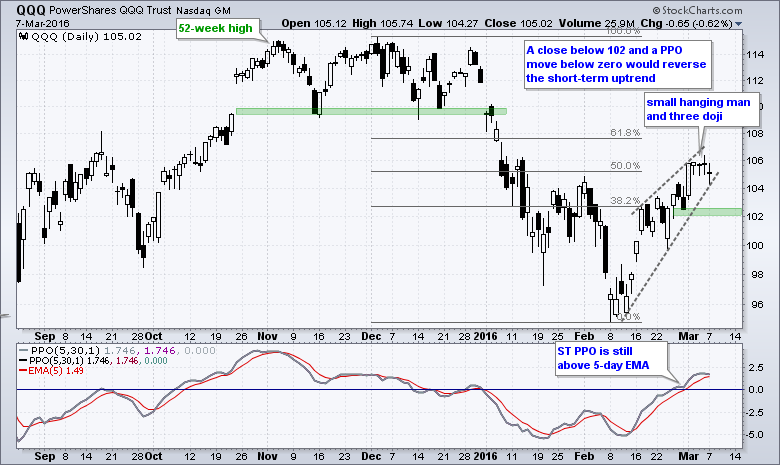
QQQ is sputtering as a small hanging man candlestick formed after the surge above 105 on March 1st. Three indecisive doji followed this candlestick and QQQ looks vulnerable to a pullback. In fact, one could even draw a wedge and point out the 50-62% retracement zone as a potential reversal area. The lower trend line of the wedge is, however, a bit too steep for my taste. I will use the 29-Feb low and a buffer to mark short-term support at 102.
IWM Continues to Lead
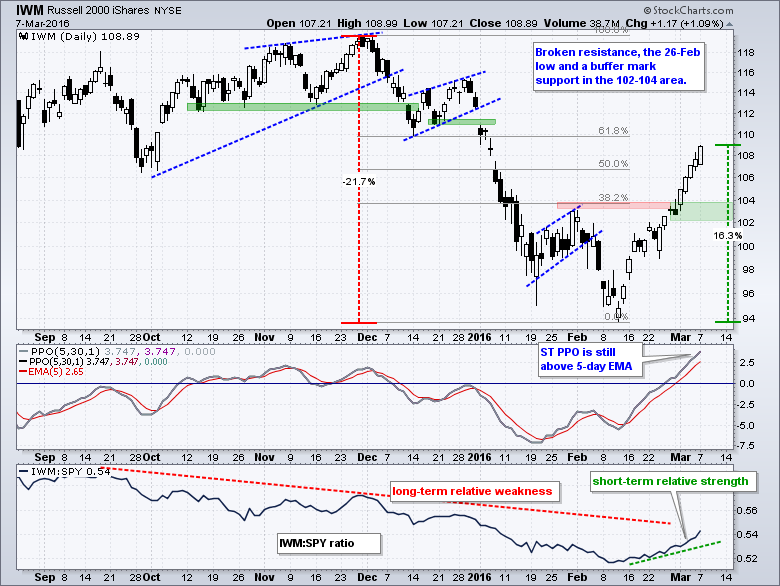
IWM is the story right now as small-caps went from laggard to leader over the last few weeks. The ETF is up around 15% with gains coming 13 of the last 16 days. At 14.88%, the 16-day Rate-of-Change is the highest since October 2011. Clearly, this is no ordinary advance. Even though the ETF remains below the 61.8% retracement line, it is clearly the leader right now and relative strength in small-caps explains strong breadth in the stock market. IWM is also getting extended and ripe for a rest. Broken resistance and the 29-Feb low mark support in the 102-104 area.
Bond Trends Favor Stocks
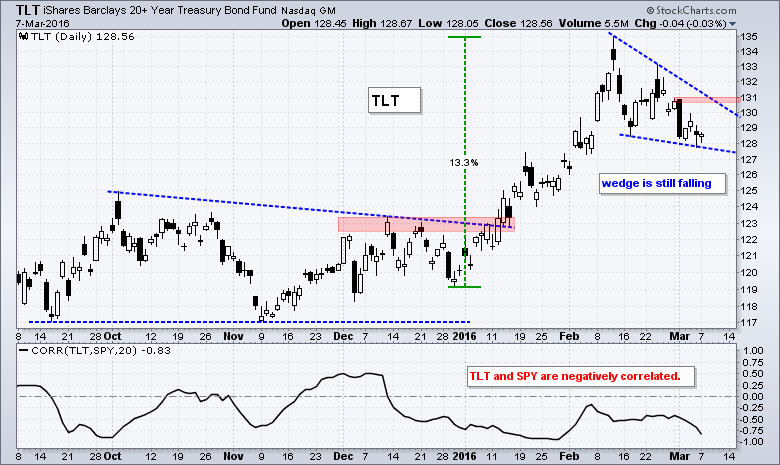
The decline in Treasuries and surge in junk bonds fueled the rally in stocks. We can also thrown in the advance in oil, which helped the junk bond market. As such, I will be watching the 20+ YR T-Bond ETF (TLT) and the High Yield Bond SPDR (JNK) for clues on the stock market. TLT surged from the 120 area to the 134 area as the stock market fell from late December to mid February. Notice that the Correlation Coefficient ($SPX,) turned negative in mid December and remains negative. This negative correlation continued as TLT fell back over the last three weeks and stocks surged. TLT formed a falling wedge that could turn out to be a mere correction after the double digit advance. A close above 131 would break resistance and reverse the short-term downtrend. Such a move would be negative for stocks.
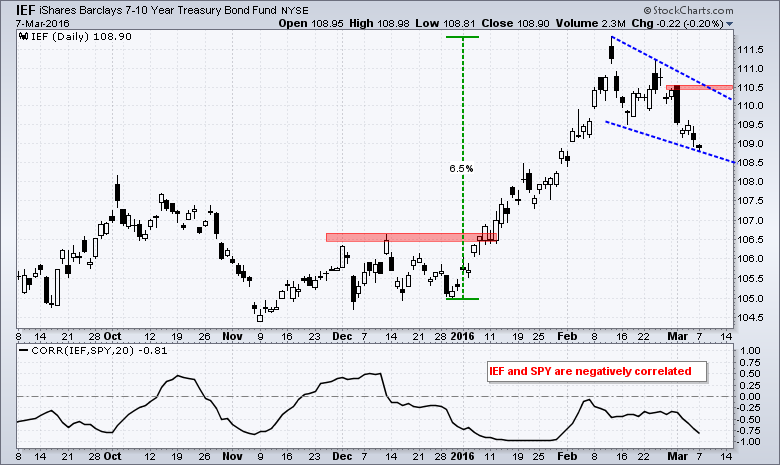
Resistance for the 7-10 YR T-Bond ETF (IEF) is marked at 110.6.
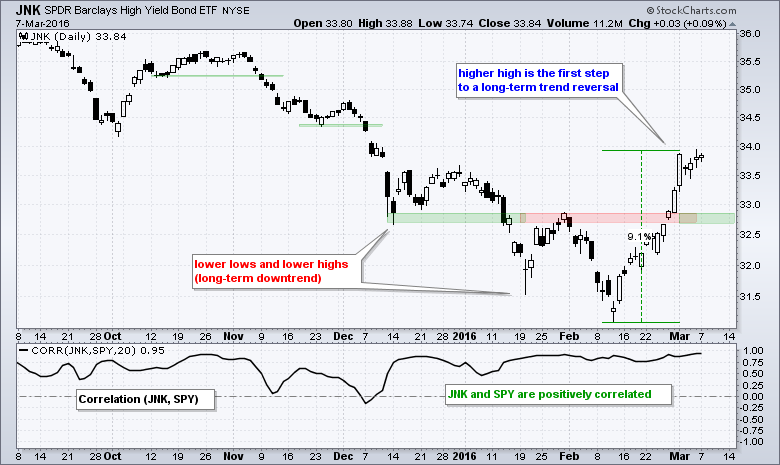
The High Yield Bond SPDR (JNK) is up around 9% from the mid February low to the early March high. Even though the ETF has stalled somewhat the last four days, the short-term trend is clearly up and this big advance could be the start of a long-term uptrend. At the very least, strength in JNK signals a firming in the credit markets and this is a big relief to the financial markets. Broken resistance turns first support in the 32.7-32.8 area. Notice that JNK and SPY have a strong positive correlation. In fact, this positive correlation is much stronger than the recent positive correlation between SPY and oil.
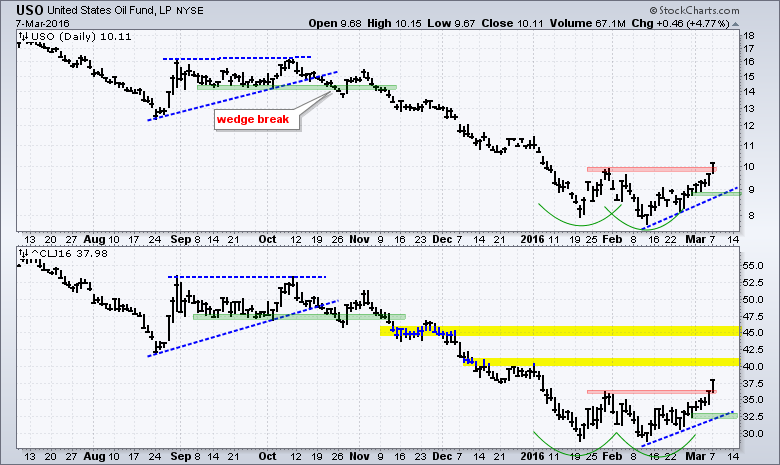
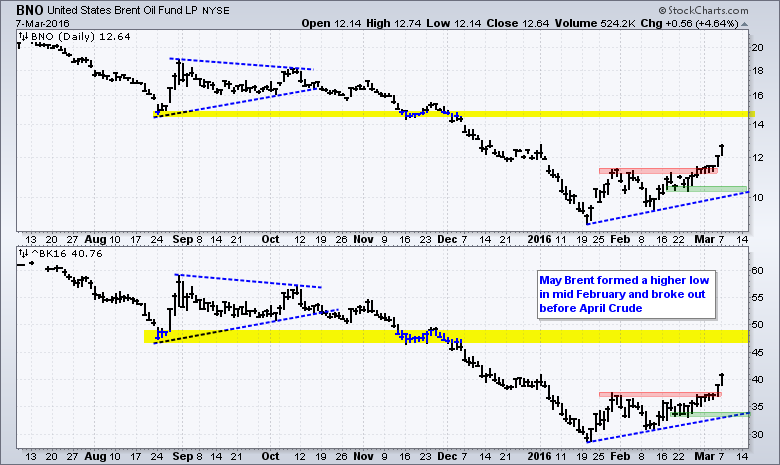
April Crude Breaks Prior High
April Crude (^CLJ16) broke above its January high to confirm a small double bottom. Note that April Gasoline (^RBJ16) broke above its January high with a 4.39% advance, April Heating Oil (^NGJ16) broke resistance with a big move on Friday and Brent Crude is stronger than Light Crude overall. The lower window in the chart shows April Crude breaking its January high with a two-day surge above 37. The double bottom targets a move to the low 40s. The yellow areas mark potential resistance in the 40-41 area and the 45 area. As with SPY, I will use the 29-Feb low to mark support at 32.4 and a close below this level would reverse the short-term upswing (and negate the double bottom).
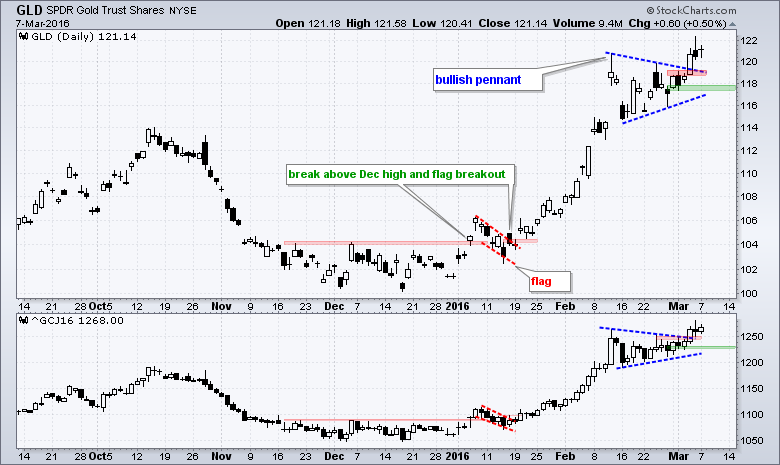
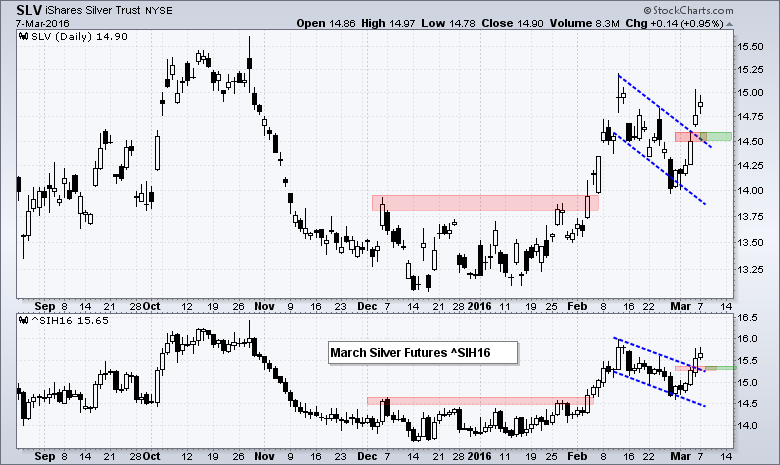
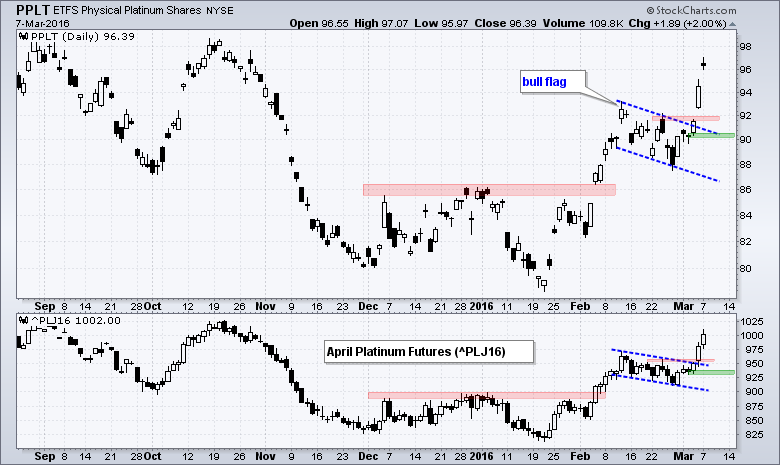
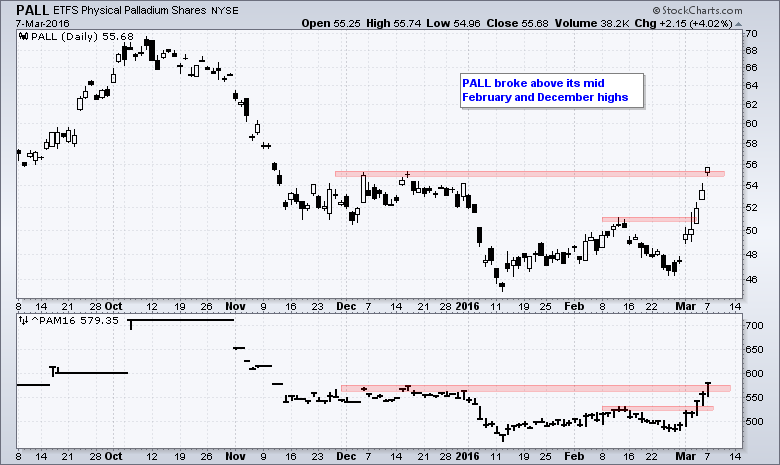
Gold, Platinum and Silver Hold Breakouts
Precious metals are on the move with the Palladium ETF (PALL) surging almost 20% and the Platinum ETF (PPLT) up almost 10% the last six trading days. The next four charts show the commodity ETF in the top window and the futures contract in the bottom window. The metals ETFs track the futures contracts pretty well so one could just look at the ETF for analysis. Note that these were featured in Art's Charts on Thursday - just before the breakouts. My little boast probably means they will not fail :o). The Gold SPDR (GLD) broke pennant resistance and I am raising short-term support to 117. A close below this level would negate the pennant breakout.
The Silver ETF (SLV) broke flag resistance with a surge above 14.5 and this breakout zone is the first level to watch for signs of a failed breakout.
The Platinum ETF (PPLT) broke flag resistance with a big surge the last three days and I am setting first support at 90.
The Palladium ETF (PALL) is on a tear with a six day surge that exceeded the December highs.
Ranking the Sectors on 6-month Performance
We can use the six month Stochastic Oscillator to rank chart performance for ETFs now that the spike low on August 24th is out of the picture. The 125-day Stochastic Oscillator measures the relationship of the current price to its six month high-low range. A high value (>90) means price is near the top of this range and a low value (<10) means it is near the bottom of this range. I use this indicator to scan for "chart" performance because stocks and ETFs with high Stochastic values show relative "chart" strength. I also view this as a volatility-adjusted performance ranking because it does not take into account price changes (just relative price levels).
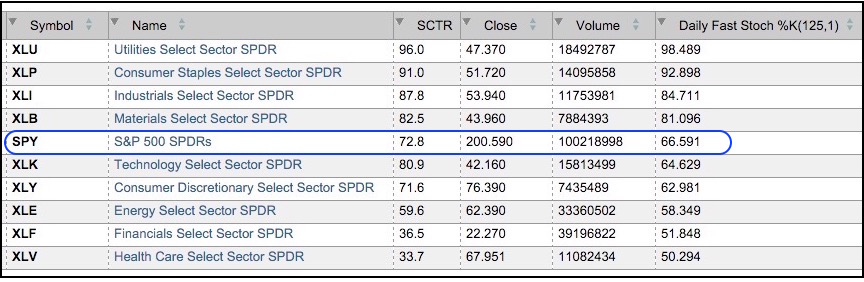
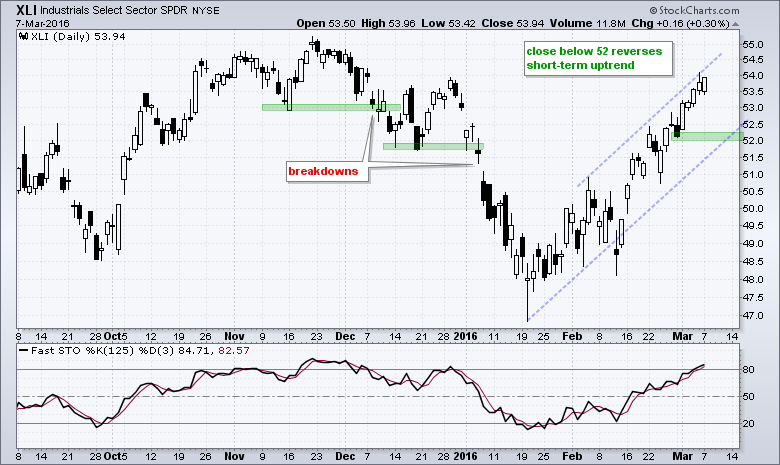
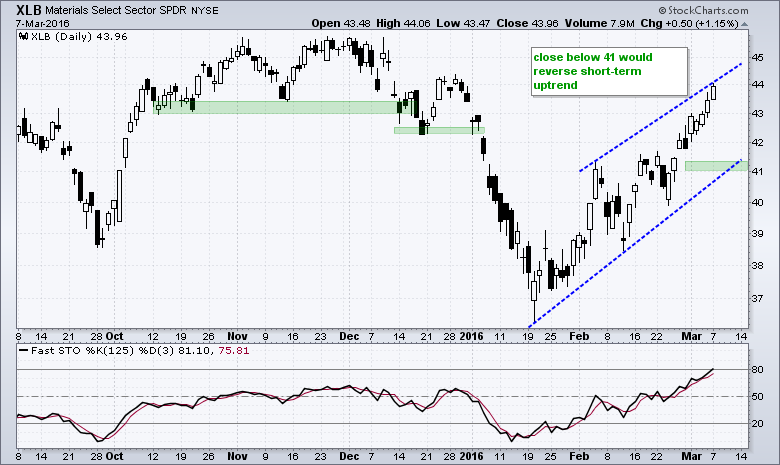
The table above shows scan results ranked by the 125-day Stochastic (%K) for the 9 sectors and SPY. XLU and XLP are still at the top and still the closest to new highs. XLI and XLB are next with Stochastic values above 80. SPY marks the dividing line between relative strength and relative weakness. The other five sectors are below SPY and not as strong. Notice that XLF and XLV are the weakest of the nine and their SCTRs are below 40.
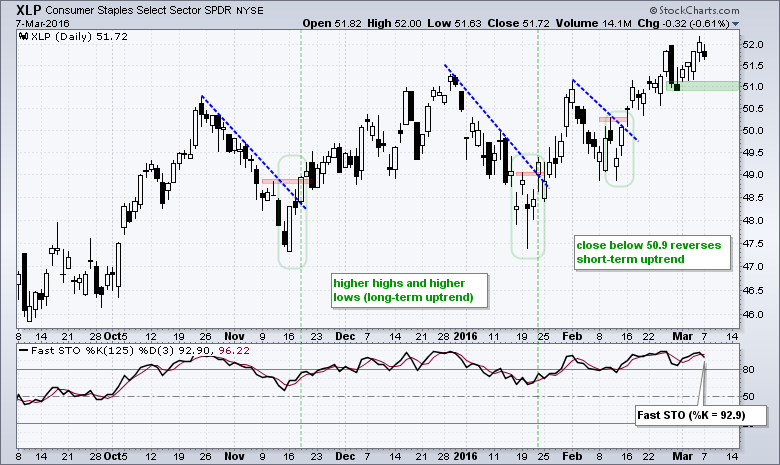
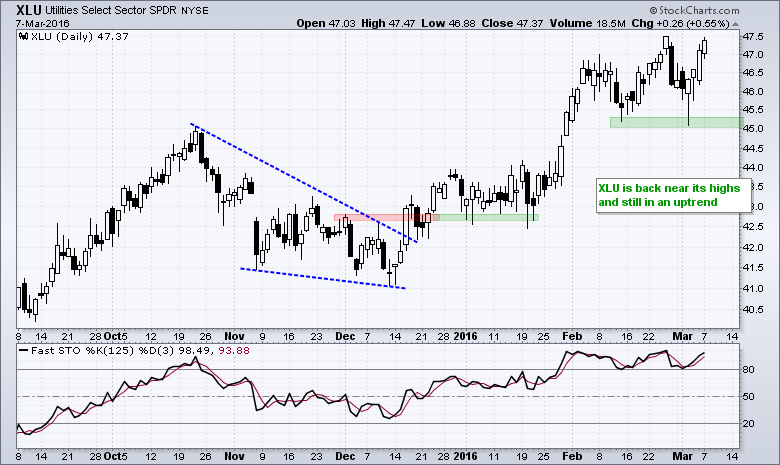
XLU and XLP Still Leading
XLP hit a new high on Friday and fell back on Monday. This chart covers six months and the high-low range of the last 125 periods, which is used in the 125-period Fast Stochastic Oscillator. Notice that %K is at 92.9 (black line). XLP may experience a short-term pullback, but the overall trend is up and the short-term trend is up as long as 50.90 holds. In fact, the four leaders are in short-term uptrends and I am marking support with the green shading.
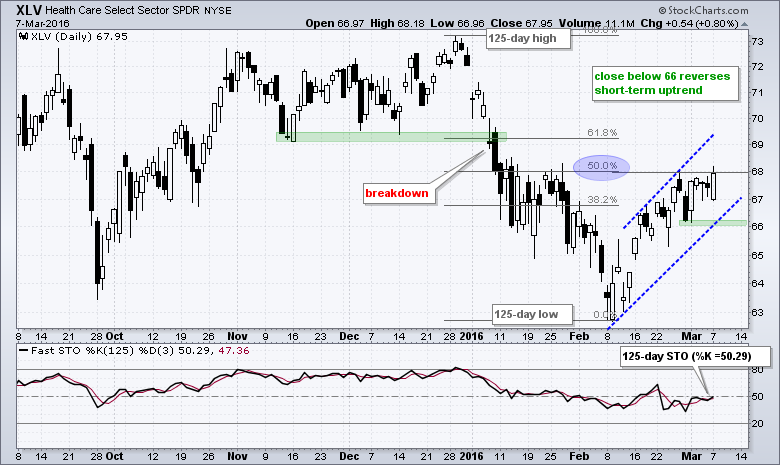
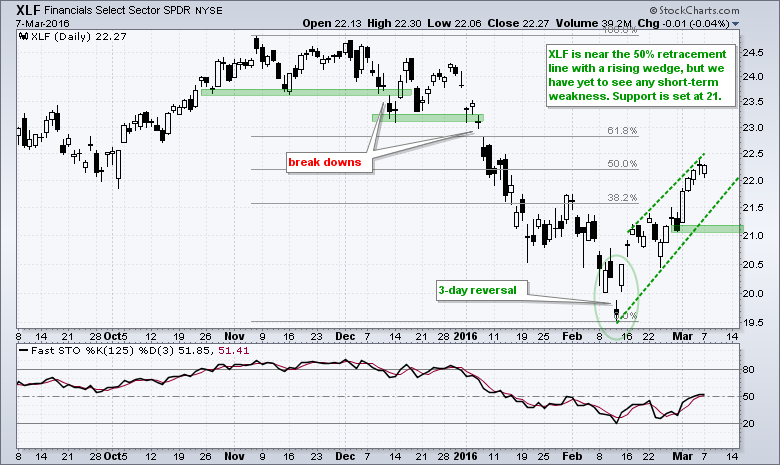
XLF and XLV Lagging
The next five are not as strong as SPY, but are in short-term uptrends and supporting the broader market right now. A downtrend in SPY is unlikely until we see short-term break downs in at least five of the nine sector SPDRs. XLV retraced 50% of its prior decline with a move to 68. Notice that this decline started from the 125-day high and ended at the 125-day low and the Fibonacci Retracements Tool shows the 50% line at 68. This matches with the 125-day Fast Stochastic Oscillator at 50.29. Despite relative weakness, the short-term trend is up as long as 66 holds.
Other Commentary Links
Bear Market Bounces - Understanding Bear Market Patterns, Signals and Retracements.
Measuring Risk On-Risk Off - Using charts to quantify stock, economic and credit risk.
PPO Trading Strategy - How to use 3 PPOs to develop a trend-reversion trading strategy.
Long-term Trend Indicators - Using the PPO, EMA Slope and CCI to determine the trend.
ETF Master ChartPack - 300+ ETFs organized in a Master ChartList and in individual groups.
Follow me on Twitter @arthurhill - Keep up with my 140 character commentaries.
****************************************
Thanks for tuning in and have a good day!
--Arthur Hill CMT
Plan your Trade and Trade your Plan
*****************************************


