Risk Indicators Still Bullish // SPY Leads with Strongest Short-term Uptrend // Energy, Finance and Healthcare are the Laggards // Consumer Discretionary SPDR Holds Breakout // Industrials SPDR Nears Prior High // Webinar Preview ////
Risk Indicators Still Bullish
The financial markets still have a good appetite for risk and this is bullish for stocks. The image below sums up the risk appetite with four charts and three still look bullish. SPY is trending up with support marked in the 195-197 area. The 10-YR Treasury Yield ($TNX) is moving higher with support in the 18 area (1.8%). Note that SPY and the 10-yr yield are positively correlated and yields rise when bonds fall. Money is moving out of safe-haven bonds and this is positive for stocks. A break below 1.8% would be bullish for T-Bonds and negative for stocks.
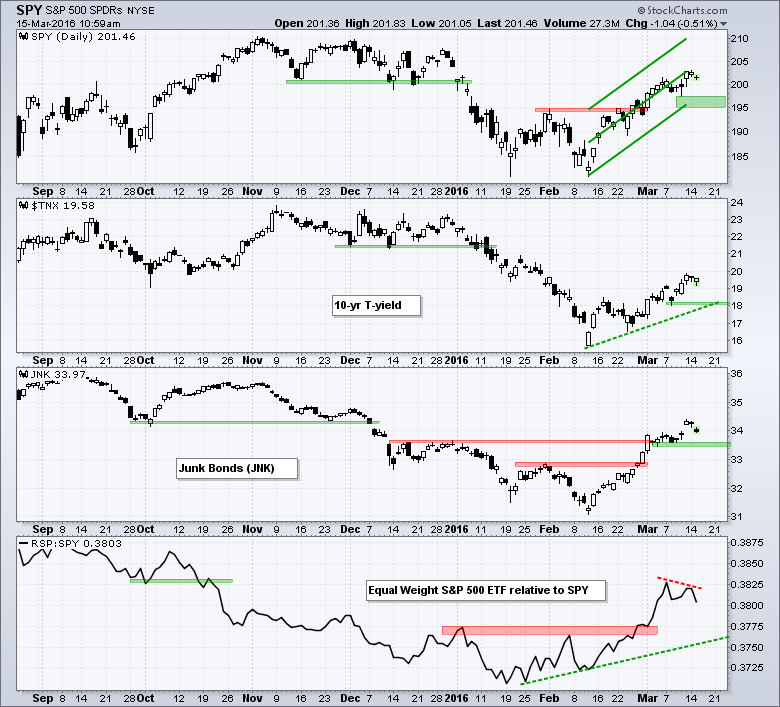
The High Yield Bond SPDR (JNK) surged over 10% with a strong move and remains in a short-term uptrend. Strength in junk bonds means credit conditions are improving. A break below 33.4 would show selling pressure and suggest a tightening in the credit markets. The last window shows the EW S&P 500 ETF (RSP) relative to SPY. Notice that the equal-weight S&P 500 outperformed from late January to early March. The overall trend is up for this ratio, but relative strength has slowed as the price relative formed a lower high the last two weeks. Relative strength in small and mid-caps is fading a bit and I will be watching this indicator closely.
SPY Leads with Strongest Short-term Uptrend
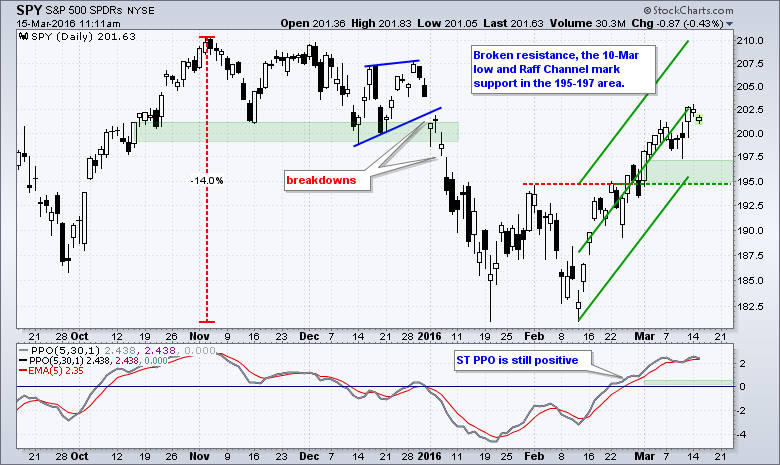
The S&P 500 SPDR (SPY), Nasdaq 100 ETF (QQQ) and Russell 2000 iShares (IWM) remain in short-term uptrends - and nothing else matters (#metallica). The advance began with the candlestick reversal in mid February and the three gaps (12, 16 and 17 February). Since the mid February reversal, down days in SPY have been limited to two in a row. In other words, we have yet to see three consecutive down days since early January. March has been a strong move with SPY up eight of the last ten days. At this point, I am not marking resistance levels and will instead focus on the current advance because I think the existing trend is more important that potential resistance. The Raff Regression Channel, broken resistance and the 10-March low mark a support zone in the 195-197 area. A pullback to this area and a PPO (5,30,1) pullback to the 0-1 area could provide a short-term bullish setup.
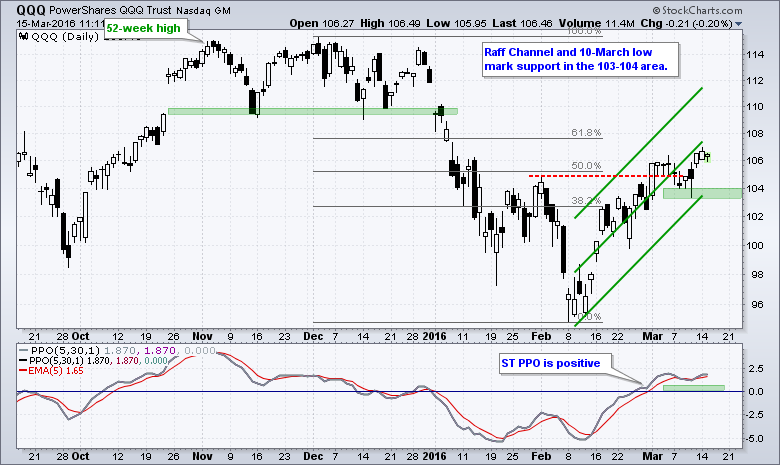
QQQ remains in a precarious spot because the short-term trend is up, but the ETF is trading in the 50-62% zone. I am watching this zone because this is where one would expect a counter-trend bounce to reverse. As with SPY, I am mostly focused on the current up trend, which started in mid February. The Raff Regression Channel and 10-March low mark support in the 103-104 area. A close below 103 would reverse the short-term uptrend in QQQ.
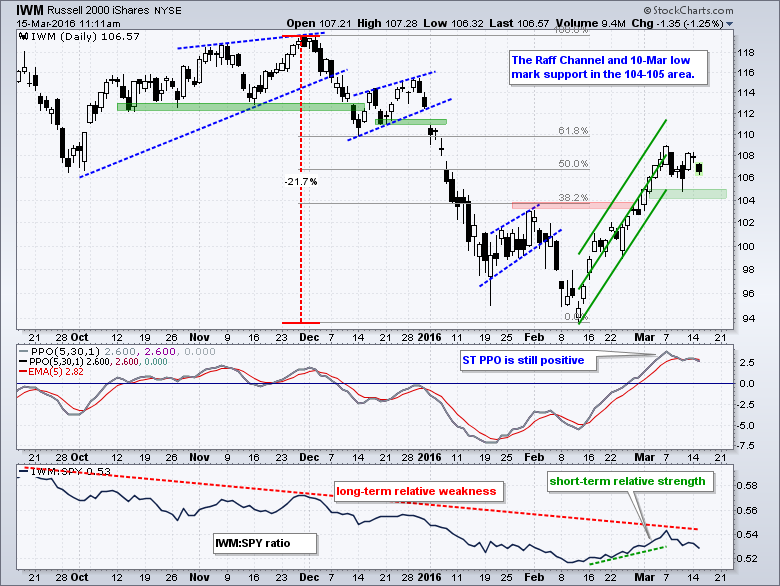
IWM outperformed the broader market from mid February to early March, but started underperforming the last five days. Notice that IWM did not exceed its 7-Mar high, whereas QQQ and SPY did. The short-term trend is still up and I am raising key support to the 104-105 area. Thus, it would take a ~4% decline to break support and reverse the short-term uptrend.
As far as the broader market is concerned, the immediate trend is up and chartists can watch the short-term support levels on the charts above for signs of a trend reversal. The jury is still out on the long-term trend, but I think the cup is half full because of the bullish breadth thrust from mid February to early March. At the very least, I have yet to get a signal that would negate this breadth thrust.
Energy, Finance and Healthcare are the Laggards
Note that all nine sector SPDRs are above their 50-day SMAs and six of the nine are above their 200-day SMAs. The HealthCare SPDR (XLV), Finance SPDR (XLF) and Energy SPDR (XLE) remain below their 200-day SMAs and these three show relative weakness overall. I don't view these moving averages as support or resistance levels. Instead, they are just common levels that we can use when comparing charts.
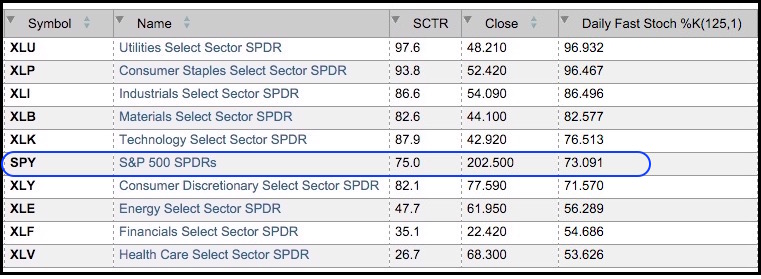
The table above shows the nine sector SPDRs ranked by the 125-day Fast Stochastic Oscillator. The higher the 125-day Fast Stochastic Oscillator, the closer the ETF is to a six month high. SPY is highlighted in blue for a reference. Sectors below SPY show relative chart weakness, while sectors above show relative chart strength. The SCTR is also shown on this table. Notice that the SCTRs for XLP and XLU are above 90. The SCTR's for XLI, XLB, XLK and XLY are above 80. There are some strong sectors right now and this is enough to keep the broader market afloat.
XLY Holds Breakout
As far as the broader market is concerned, I am focusing on the big five: technology, consumer discretionary, industrials, finance and healthcare. These five account for around 75% of the S&P 500. The market is in good shape as long as these hold their short-term uptrends. The trouble starts when/if three of the five break support. To keep things uniform, I am using the Raff Regression Channel to define the short-term uptrends and help mark support.
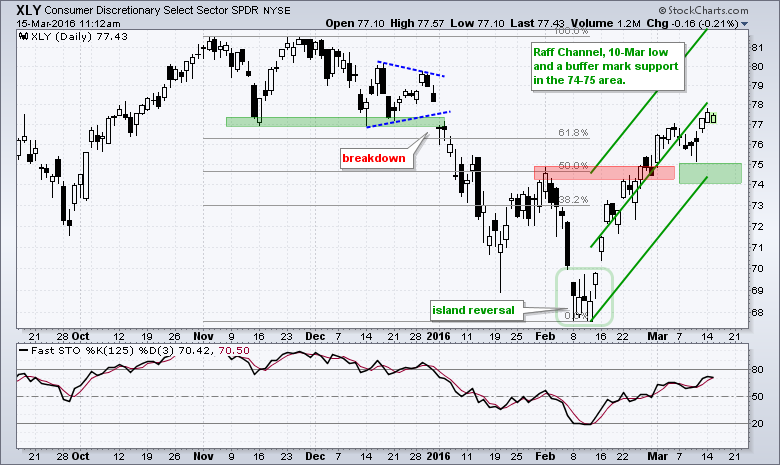
As with the major index ETFs, the short-term uptrend in XLY is too steep for trend lines so I am using the Raff Regression Channel to define this uptrend. The channel extends from the mid February closing low to the highest close of the move (Monday's close). The lower line, broken resistance, the 10-Mar low and a buffer mark support in the 74-75 area. A close below 74 would reverse the short-term uptrend.
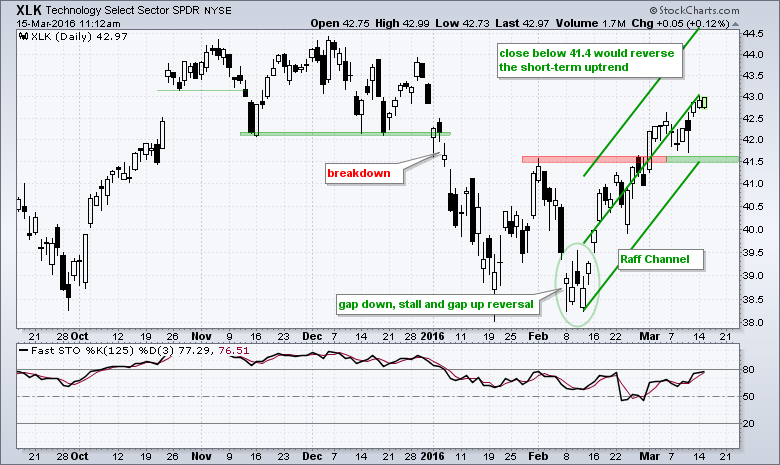
XLK is also in the midst of a steep advance. Broken resistance, the 10-Mar low and the Raff Regression Channel mark support in the 41.50 area. A close below 41.4 would break short-term support and reverse the upswing.
XLI Nears Prior High
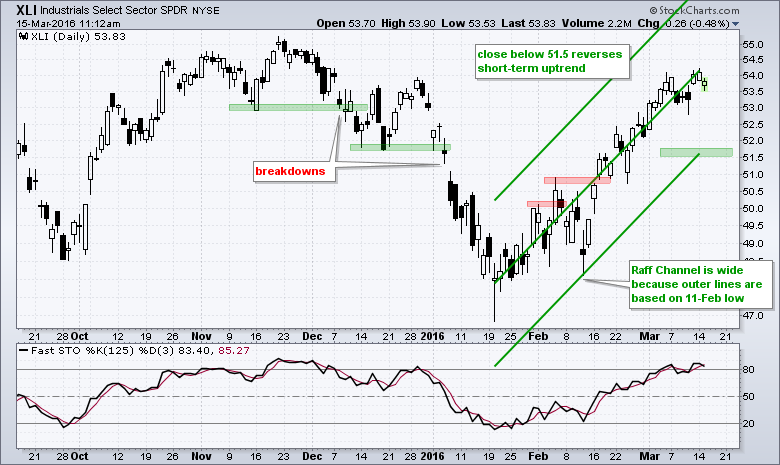
The Industrials SPDR (XLI) is one of the strongest sectors since mid January. I added a Raff Regression Channel to define the current advance. Notice that this channel is wide because of the 11-Feb low. The outer lines are equidistant from the centerline and based on the furthest high or low, which is the 11-Feb low. XLI is up sharply and I think we should give it some room to maneuver before calling a trend reversal. Key support is set at 51.50
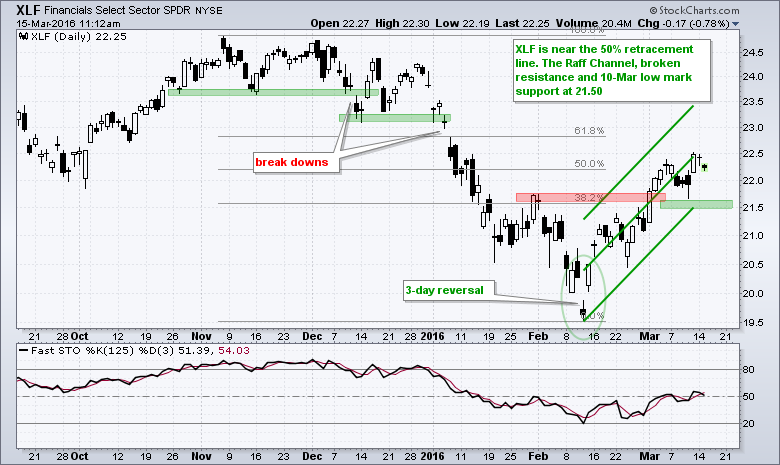
The Finance SPDR (XLF) is one of the least strong sectors and the current advance could be a bear market rally because, but the short-term trend is up as long as 21.5 holds on a closing basis.
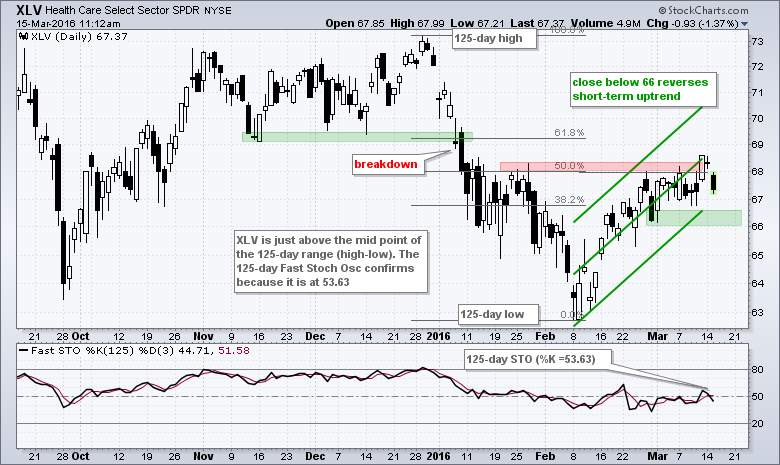
The HealthCare SPDR (XLV) moved above the 50% retracement line as the 125-day Stochastic Oscillator moved above 50. This is one of the weaker advances, but the short-term trend is up as long as 66 holds (on a closing basis).
Other Commentary Links
Bear Market Bounces - Understanding Bear Market Patterns, Signals and Retracements.
Measuring Risk On-Risk Off - Using charts to quantify stock, economic and credit risk.
PPO Trading Strategy - How to use 3 PPOs to develop a trend-reversion trading strategy.
Long-term Trend Indicators - Using the PPO, EMA Slope and CCI to determine the trend.
ETF Master ChartPack - 300+ ETFs organized in a Master ChartList and in individual groups.
Follow me on Twitter @arthurhill - Keep up with my 140 character commentaries.
****************************************
Thanks for tuning in and have a good day!
--Arthur Hill CMT
Plan your Trade and Trade your Plan
*****************************************


