SPY Takes the Lead as QQQ Extends Breakout // Defensive Sectors Still Leading, but Tech is Performing Well // Materials and Industrials Challenge Long-term Downtrends // Consumer Discretionary Remains a Mess // Healthcare, Energy and Finance Round out the Bottom // Still Watching High-Low Percent // Tweaking the Percent from High Scan // Zweig Breadth Thrust Revisited // Nasdaq AD Line is Suspect // Friday Food for Thought ////
SPY Takes the Lead
March madness continues as the S&P 500 SPDR (SPY) extended its bounce with a move above 200 this week. This advance all started when the February "support" break around 185 did not hold. The ETF then surged above the February 1 high (red resistance) and broke the 50-day SMA. It was overbought in late February and simply became even more overbought the last two weeks. The ability to become "overbought" and remain overbought shows strength. After all, it takes strong buying pressure to become overbought.
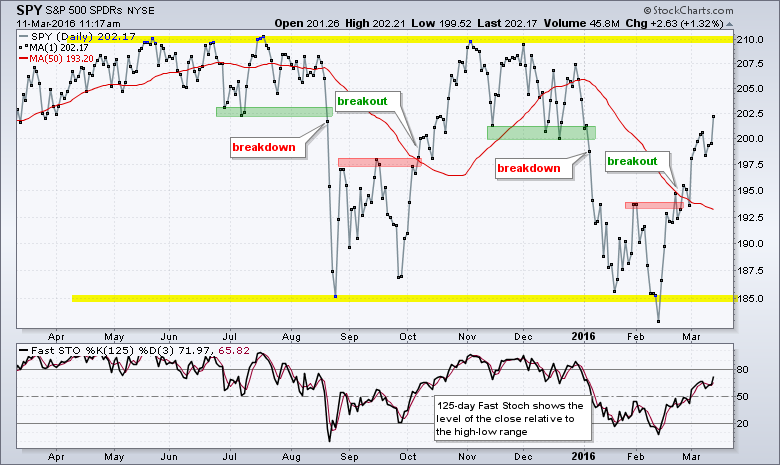
Trading has been quite volatile since August, but the cup has swung to half full with the late February breakout. The prior three breaks did not result in extended trends because they were reversed within two to three months. I do not know if this breakout will hold (nobody knows!), but I do know that it is holding right now and SPY is leading the market. The indicator window shows the 125-day Fast Stochastic Oscillator to measure chart strength. As noted in Tuesday's webinar, this version on the Stochastic Oscillator measures the level of the close relative to the high-low range. 125 days extends around 6 months. Thus, a high Stochastic Oscillator value (>90) means price is near a six month high and a low value (<10) means price is near a six month low. Of SPY, QQQ and IWM, SPY has the highest value for the 125-day Fast Stochastic Oscillator and shows the most chart strength over the last six months.
QQQ Extends Breakout
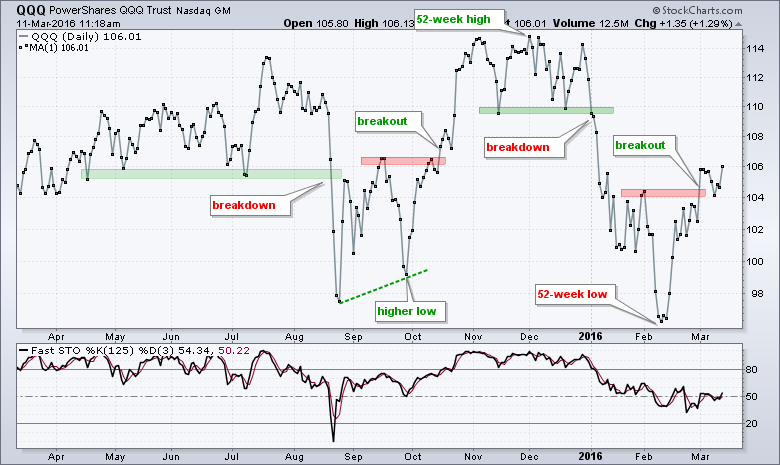
QQQ swung from a 52-week high to a 52-week low in less than three months. The swings are big and it is hard to tell how long they will last, but the current swing is clearly up with the break above the February 1 high. The 125-day Fast Stochastic Oscillator is around 55, which means QQQ is just above the mid point of its six month range. The cup is half full.
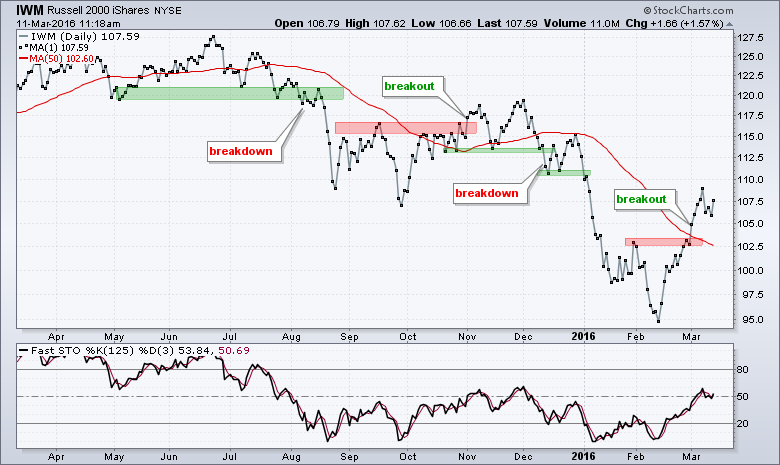
IWM has the weakest looking one-year chart of the three, but it also sports the biggest gain from mid February to now. Also notice that the ETF is around 4.5% above its 50-day SMA. Even though the bigger trend appears to be down, the strength of this advance is impressive and could result in a bigger trend change.
Defensive Sectors (sans XLV) Still Leading
As of Thursday's close, all nine sector SPDRs were above their 50-day SMA and eight of the nine equal-weight sector ETFs were above their 50-day SMAs. The EW Healthcare ETF (RYH) was the only one that had yet to cross. I don't use moving averages to mark support or resistance levels, but I do use them to gauge the overall trend and compare charts. Stocks and ETFs above the 50-day SMA show relative chart strength and have some sort of uptrend at work. The further above the SMA, the more chart strength. Stocks and ETFs below the 50-day SMA show relative chart weakness and have some sort of downtrend at work. The further below the SMA, the more chart weakness. I would not expect the broader market to turn down until we start seeing some sectors move below their 50-day SMAs.
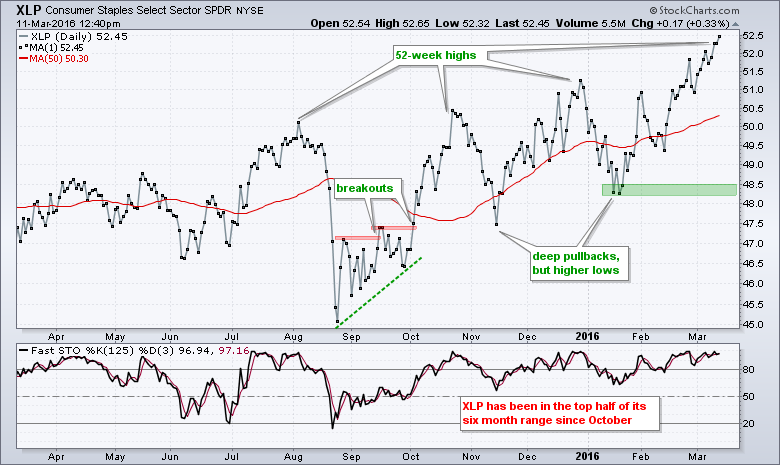
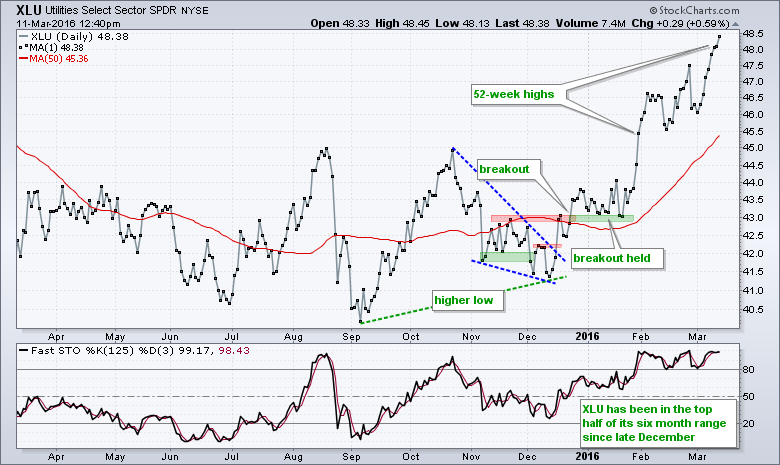
Two of the nine sector SPDRs recorded new 52-week highs this week: the Utilities SPDR (XLU) and the Consumer Staples SPDR (XLP). Their respective equal-weight sector ETFs also recorded 52-week highs. These two defensive sectors are the undisputed leaders right now. XLU and XLP may be getting extended on the upside, but there are no signs of weakness on these charts right now.
Tech Still Performing Well
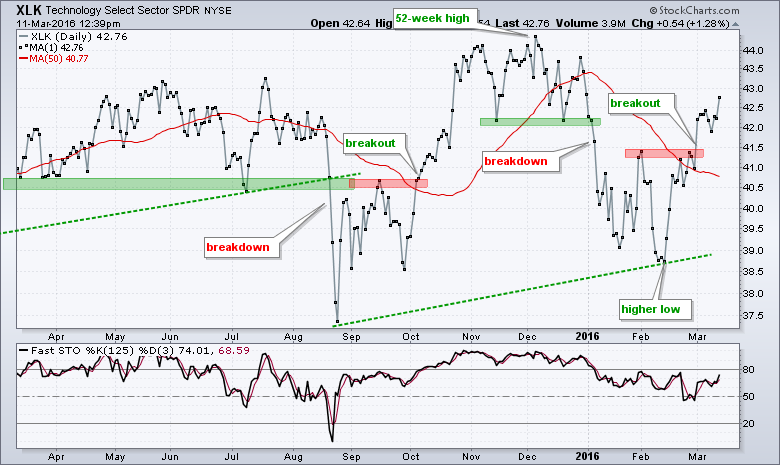
The Technology SPDR (XLK) has been all over the board since August, but the overall trend remains up and I am putting it in third place. Notice that XLK hit a 52-week high in December, did not record a 52-week low in February and held above the August low. The breakout on March 1st is holding and the ETF is well above its 50-day SMA. Also notice that the 125-day Stochastic Oscillator is above 70.
Materials and Industrials Challenge Long-term Downtrends
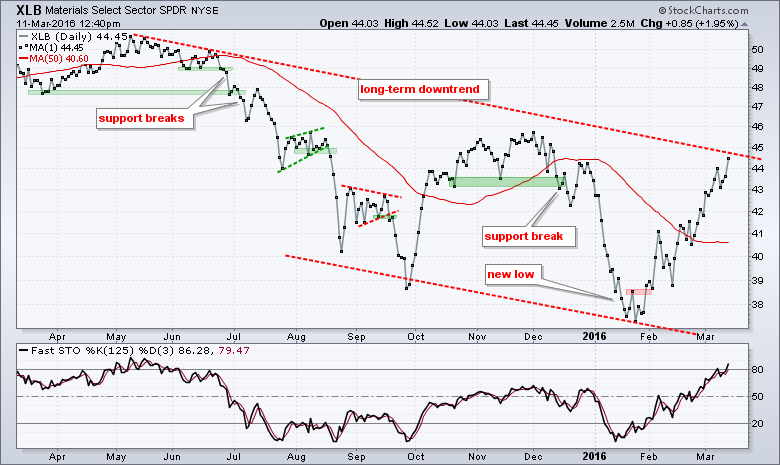
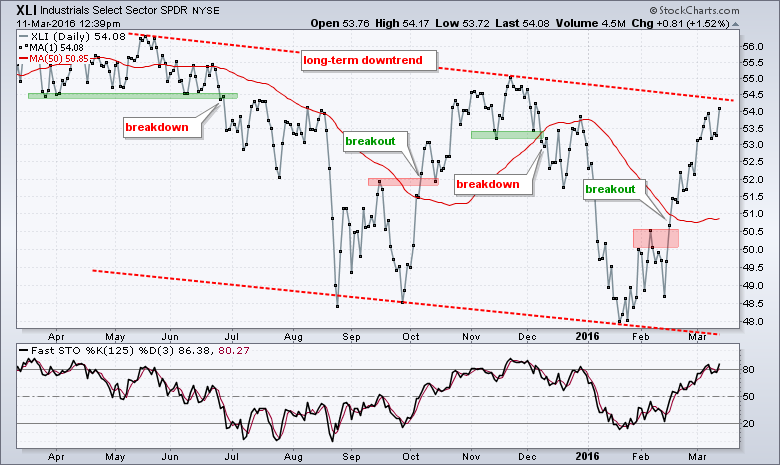
The Industrials SPDR (XLI) and the Materials SPDR (XLB) are next in line for chart performance (4th and 5th place). Both are well above their 50-day SMAs and the 125-day Fast Stochastic Oscillator is above 70. Looking at the price charts, I can make the case for a long-term downtrend over the past year and a short-term uptrend since late January. The advances over the last six to eight weeks were strong, but they have yet to break the November-December high for a long-term trend reversal.
Consumer Discretionary Remains a Mess, But in an Upswing
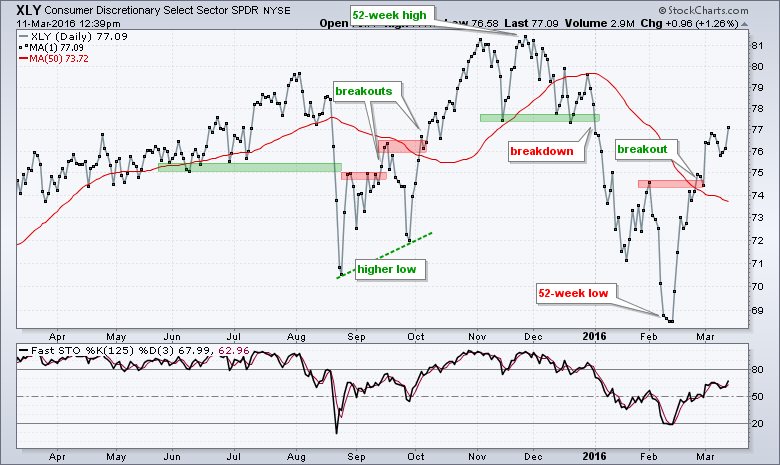
Trying to make heads or tails of the Consumer Discretionary SPDR (XLY) is a real challenge. The ETF hit a 52-week high in late November and a 52-week low in mid February - less than three months later. In the meantime, it has crossed the 75 level dozens of times with the most recent cross occurring on March 1st. The cup is half full with this latest cross and the 125-day Stochastic Oscillator is at 62 (half full as well).
Healthcare, Energy and Finance at the Bottom
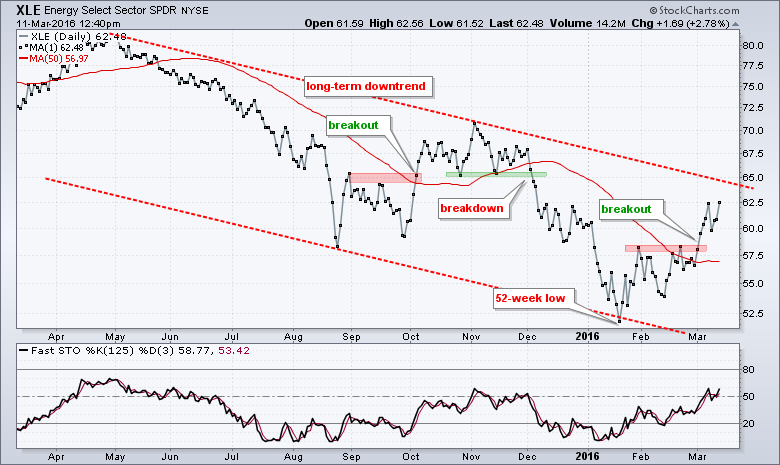
Now it is time for the bottom three sectors: the Energy SPDR (XLE), the Finance SPDR (XLF) and the HealthCare SPDR (XLV). Again, I am looking at three things to gauge performance: distance above 50-day SMA, value of Stochastic Oscillator and current price compared to the January peak. XLE is the furthest above its 50-day, it is well above the 29-Jan high and the 125-day Stochastic Oscillator is near 56. The long-term trend is down, but XLE is showing more strength than the other since mid January.
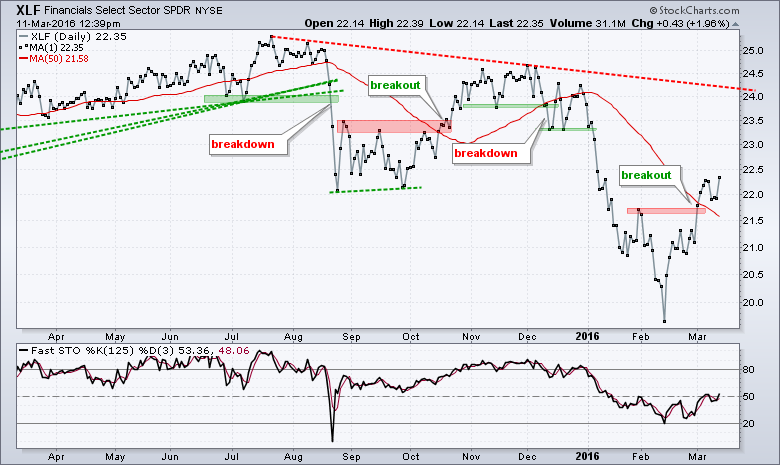
The Finance SPDR (XLF) got a 10 plus percent bounce off the mid February spike low. The long-term trend remains down, but the short term trend is up. I try to limit myself to timeframes (long-term and short-term), and focus mostly on the daily charts.
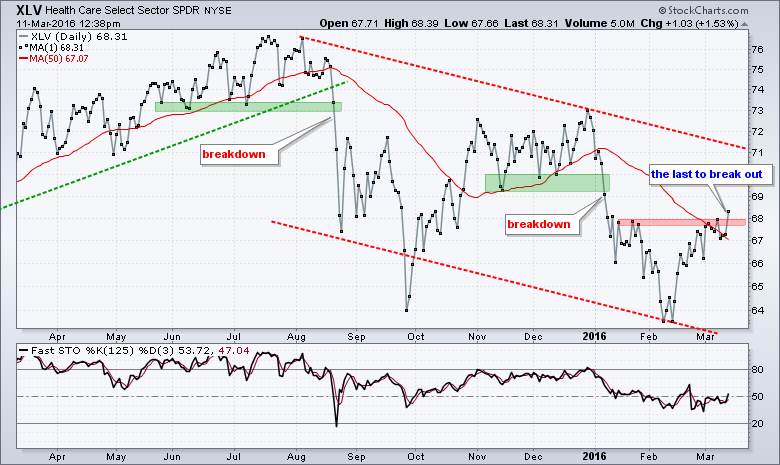
The HealthCare SPDR (XLV) has been battling the 50-day SMA and the resistance zone around 68 this week. The short-term trend is up and the ETF is getting a breakout today, but the long-term trend is down and it is the weakest sector SPDR overall.
Still Watching High-Low Percent
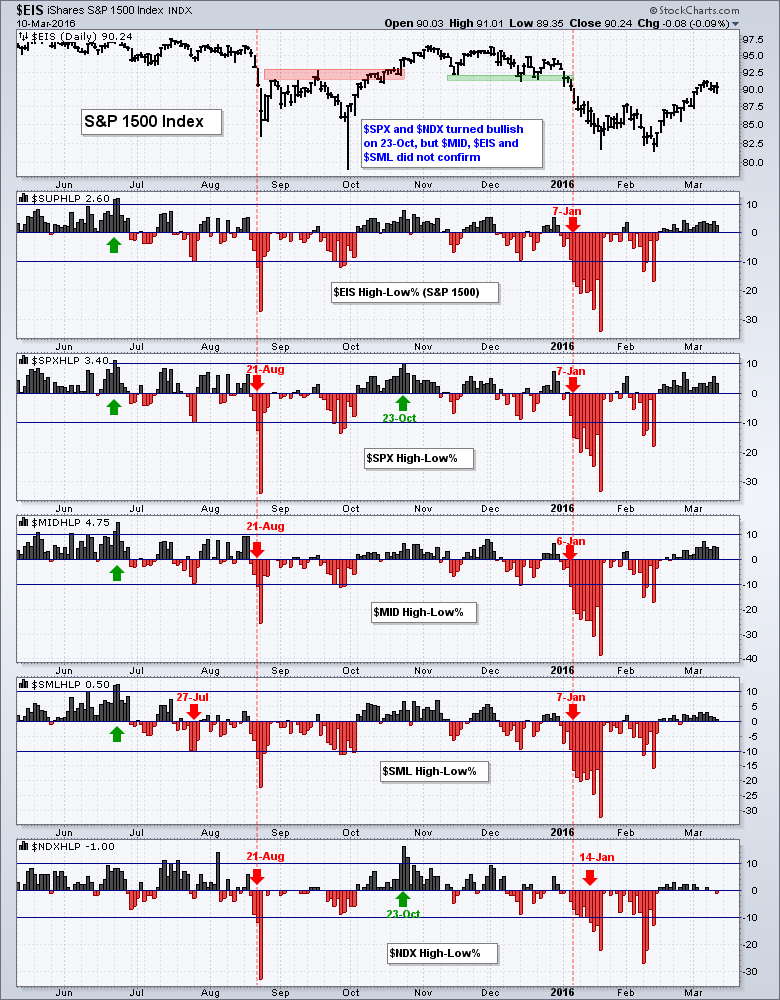
A bullish breadth thrust signaled when the 10-day EMA for S&P 1500 AD Percent ($SUPADP) moved above +30% on March 3rd. This bullish breadth thrust showed broad participation in the advance from mid February to early March - and this is bullish. Breaking down the S&P 1500, breadth indicators for the S&P MidCap 400, S&P Small-Cap 600 and Nasdaq 100 triggered bullish breadth thrusts as well. The S&P 500 was the only one to fall short as the 10-day EMA for S&P 500 AD Percent ($SPXADP) only reached 29.87 on March 3rd. Despite this near miss, I think we have a valid bullish breadth thrust signal and it has yet to be negated.
The next step would be for the High-Low Percent indicators for the S&P 1500 High-Low Percent ($SUPHLP) to move above +10%. As the chart below shows, these indicators have been mostly positive since February 17th, but they have not exceeded the +10% threshold to negate the bearish signal from January 7th. Breaking down the S&P 1500, note that the majority (3 of 5) have not been above +10% since June. We need broadening participation from small-caps and mid-caps to push S&P 1500 High-Low Percent ($SUPHLP) above +10%. Small-caps and mid-caps are leading in 2016 and continued strength would produce signals soon.
Tweaking the Percent from High Scan
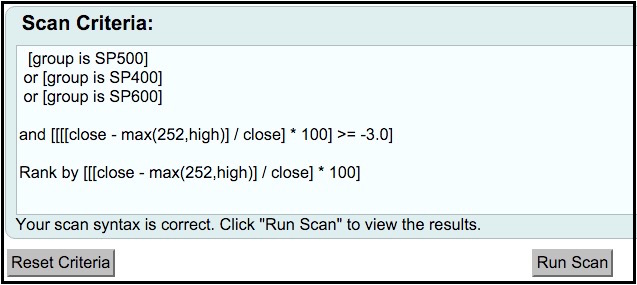
We have some great members who know a lot about the scan engine. I got a few suggestions for the "percent from high" scan and would like to share a simple scan from J.M. (thanks!). Basically, we are scanning for stocks that are within 3% of their high and then ranking by the percentage below this high. As of Thursday's close, 174 stocks in the S&P 1500 were within 3% of a 52-week high. It takes 150 to exceed +10% and trigger a bullish signal, but note that most of the current new highs come from the utilities and consumer staples sectors. Should the market turn "offensive", we could see a rotation out of these defensive names and High-Low Percent could continue soft.
Zweig Breadth Thrust Revisited
The Zweig Breadth Thrust fell short of a bullish signal, but the Appel Breadth Thrust Continuation triggered on March 1st. Huh? There was a miscommunication on the digital signal so I will explain. The second window on the chart below shows the 10-day EMA of Advances divided by Advances plus Declines (!BINYBT). A Zweig Breadth Thrust (ZBT) occurs when this 10-day EMA moves from below .40 to above .615 in 10 days or less. ZBT resets if the signal does not trigger within 10 days. The third window shows the ZBT Digital (!BINYBTD), which hits 1 on a breadth thrust. Notice that it did not hit 1 in early March. Also note that we adjusted the algorithm for !BINYBTD to reflect the parameters of the ZBT.
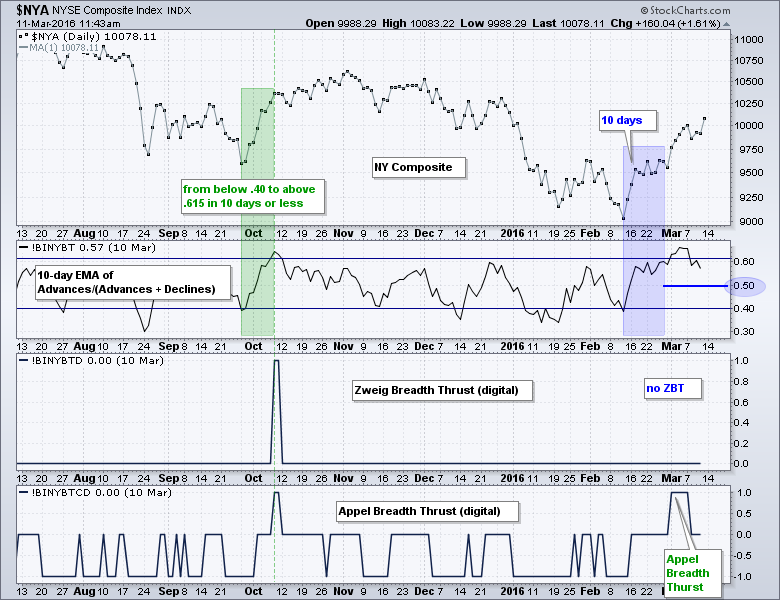 Gerald Appel, creator of MACD, added a twist to the ZBT by just requiring the 10-day EMA to move above .615. This is called the Breadth Thrust Continuation (!BINYBTCD) and the "D" at the end is for the digital signal. According to Appel, this signal remains valid until a move back below .50. Thus, we had a bullish signal from the Appel Breadth Thrust Continuation on March 1st and it remains in force until the 10-day EMA of Advances divided by Advances plus Declines moves below .50.
Personally, I do not use the McClellan indicators, the Zweig Breadth Thrust or the Appel Breadth Thrust Continuation very often. It is not because of the calculations or the theory behind the indicators. My issue is with the NYSE and Nasdaq, which are broad exchanges that include lots of low priced stocks and thinly traded stocks. I prefer to calculate breadth indicators based on ONE index that has liquid large-caps, mid-caps, small-caps, Nasdaq and NYSE stocks - all in one. That index is the S&P 1500. At best, the NYSE breadth indicators capture half the market and the Nasdaq breadth indicators capture the other half. I also like the fact that I can breakdown the S&P 1500 into the S&P 500, S&P MidCap 400 and S&P Small-Cap 600, and see breadth data for each group.
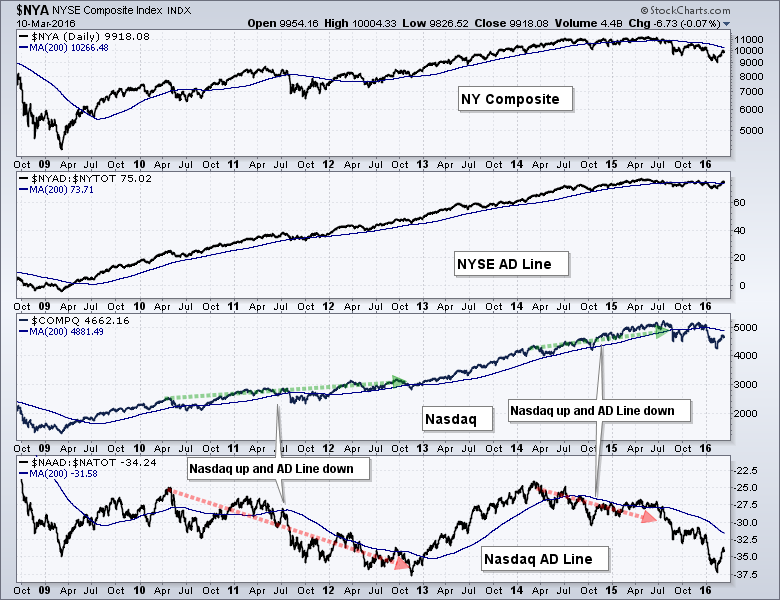
Nasdaq AD Line is Suspect
The Nasdaq AD Line is all over the place and can diverge from the Nasdaq for long periods. The Nasdaq AD Line declined from April 2010 until November 2012 as the Nasdaq moved higher (~23%). Similarly, the AD Line fell from March 2014 to July 2015 even as the Nasdaq advanced around 20%. This negative bias in the Nasdaq AD Line stems from the listing requirements, which are less stringent than those on the NYSE. There are more speculative issues in the Nasdaq and some of these end up delisting or going to the pink sheets. Here is an article on delisting from the Motley Fool.
Friday Food for Thought
Leverage for the Long Run - A Systematic Approach to Managing Risk and Magnifying Returns in Stocks
(Michael A. Gayed and Charles V. Bilello, Pension Partners)
Using leverage to magnify performance is an idea that has enticed investors and traders throughout history. The critical question of when to employ leverage and when to reduce risk, though, is not often addressed. We establish that volatility is the enemy of leverage and that streaks in performance tend to be beneficial to using margin. The conditions under which higher returns would be achieved from using leverage, then, are low volatility environments that are more likely to experience consecutive positive returns. We find that Moving Averages are an effective way to identify such environments in a systematic fashion.
When Measures Become Targets: How Index Investing Changes Indexes
(Patrick O’Shaughnessy CFA, The Investors Field Guide)
Goodhart’s law says “when a measure becomes a target, it ceases to be a good measure.” Rat’s tails and dead cobras were measures of progress against vermin overpopulation in Vietnam and India. But those measures then became the targets of enterprising citizens, and in the process ceased to be good measures.
U.S. Stock Market Recovery is Underway Unless the Fed Derails It
(Tony Dwyer, Chief Market Strategist at Canaccord Genuity)
If the Fed indicates interest rates will be increased at a faster pace, that could cause dislocation. Dwyer added that the stock market is now getting support from oil prices, which have been rising, and the dollar, which has weakened somewhat against emerging market currencies.
The Most Horrendous Lie on Wall Street
(Joshua Brown, Fortune Magazine and TheReformedBroker.com)
In other industries, higher-priced products are typically superior in both quality and efficacy—think luxury watches and cars, or the difference between a roadside motel and the Ritz-Carlton. With financial services products, however, it works in exactly the opposite way. Virtually every single piece of academic research ever produced on the topic says that the less you pay for an investment product, and the simpler it is, the better off you’ll be over the long-term.
Harvard neuroscientist: Meditation not only reduces stress, here’s how it changes your brain
(Brigid Schulte, Washington Post)
But then I did a literature search of the science, and saw evidence that meditation had been associated with decreased stress, decreased depression, anxiety, pain and insomnia, and an increased quality of life.
Other Commentary Links
Bear Market Bounces - Understanding Bear Market Patterns, Signals and Retracements.
Measuring Risk On-Risk Off - Using charts to quantify stock, economic and credit risk.
PPO Trading Strategy - How to use 3 PPOs to develop a trend-reversion trading strategy.
Long-term Trend Indicators - Using the PPO, EMA Slope and CCI to determine the trend.
ETF Master ChartPack - 300+ ETFs organized in a Master ChartList and in individual groups.
Follow me on Twitter @arthurhill - Keep up with my 140 character commentaries.
****************************************
Thanks for tuning in and have a good day!
--Arthur Hill CMT
Plan your Trade and Trade your Plan
*****************************************


