An All Time High within Reach // When Support is Greater than Resistance // Corrections within the Uptrend // Offensive Sectors Lead // Bullish Resolutions Define Market Environment ////
An All Time High within Reach
I am operating under the thesis that there is more bullish evidence out there than bearish evidence. In other words, buying pressure is stronger than selling pressure and this favors an uptrend. Keep in mind that it only takes a 60/40 bull/bear tilt to move the market higher. The S&P 500, which accounts for some 80% of the total investable US equity market, is less than 3% from its all time high and up around 15% from its mid February low. The S&P 500 Equal-Weight Index is less than 5% from its all time high and up around 18% since mid February. These stats alone tell me that bulls have the edge right now. I am most interested in the present situation because I am lousy at predicting the future.
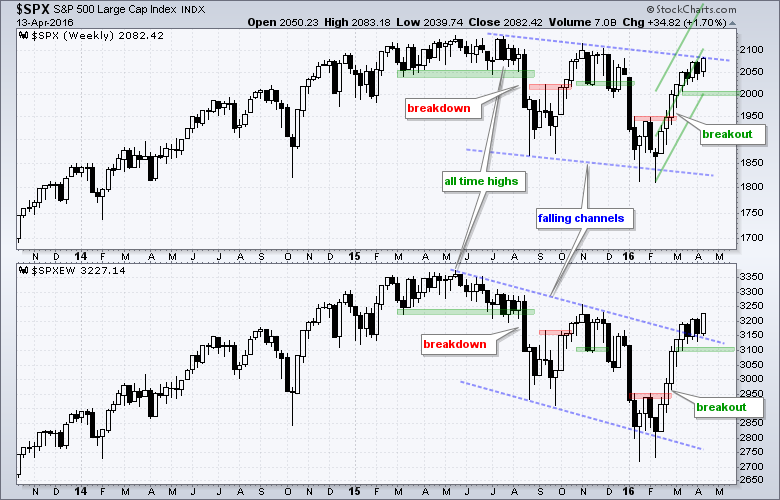
The chart above shows the S&P 500 and the S&P 500 Equal-weight Index with falling channels (blue trend lines). $SPXEW broke its channel trend line and $SPX is right at its trend line. I do not use trend lines to define support/resistance. Trend lines simply measure the rate of ascent or descent with their slope. A trend line break signals a change in the rate of ascent or descent. I do use trend lines to define patterns and the falling channel looks like one big correction after the all time highs. The green zones on the right side of the chart mark upswing support levels to watch. I expect prices to continue higher as long as support holds and this means I expect new highs in both indices.
When Support is Greater than Resistance
The weight of the evidence turned bullish in early March after the bullish breadth thrust. Prior to this breadth thrust, the S&P 500 broke above resistance with a surge in late February. With a breakout and a bullish breadth thrust, overbought conditions and resistance levels became moot. Momentum indicators are supposed to become overbought in an uptrend, and resistance levels are supposed to be broken in an uptrend. Bottom line: I ignore resistance levels and overbought conditions when the weight of the evidence favors the bulls.
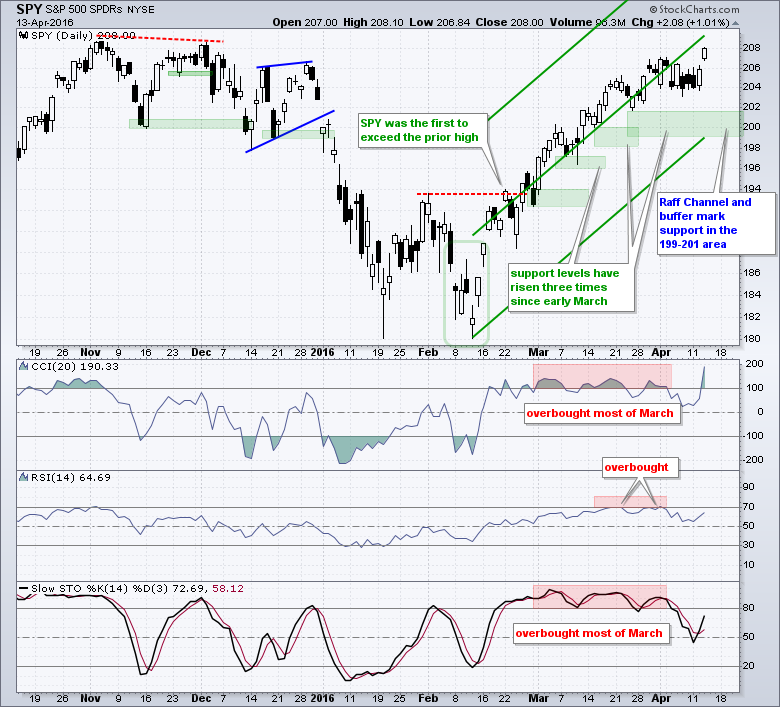
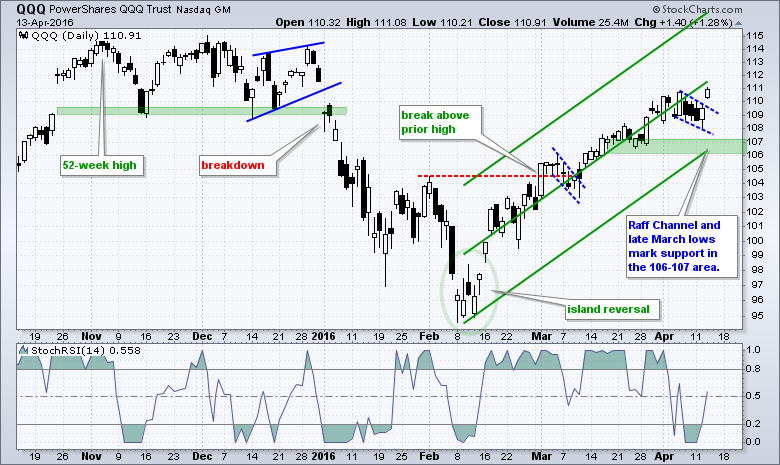
Support levels hold the key to an uptrend and these support levels are what really matters. I continue to monitor support levels for the major index ETFs and the sector SPDRs. SPY, QQQ, IWM and all nine sector SPDRs are in clear uptrends. Some are stronger than others, but all are in uptrends and we have yet to see breakdowns on the price charts. I will slowly raise support levels if the uptrends extend. I will not consider turning bearish until the majority of these support levels are broken. The chart above shows how the support levels in SPY have risen over the last five weeks.
Corrections within the Uptrend
Short-term corrections are considered opportunities, not threats. Stocks can correct using price, time or both. A price correction occurs with a pullback, while a time correction occurs with a consolidation or sideways trading range. A correction after a sharp advance is healthy and represents the pause that refreshes. The chart below shows IWM with a pennant breakout in mid March and a flag breakout this week. The throwback after the flag breakout was a little deep, but IWM did not break below the pennant low. At this point, the flag breakout is bullish and the flag lows mark first support at 108. The Raff Regression Channel and late March low mark medium-term support in the 105-106 area.
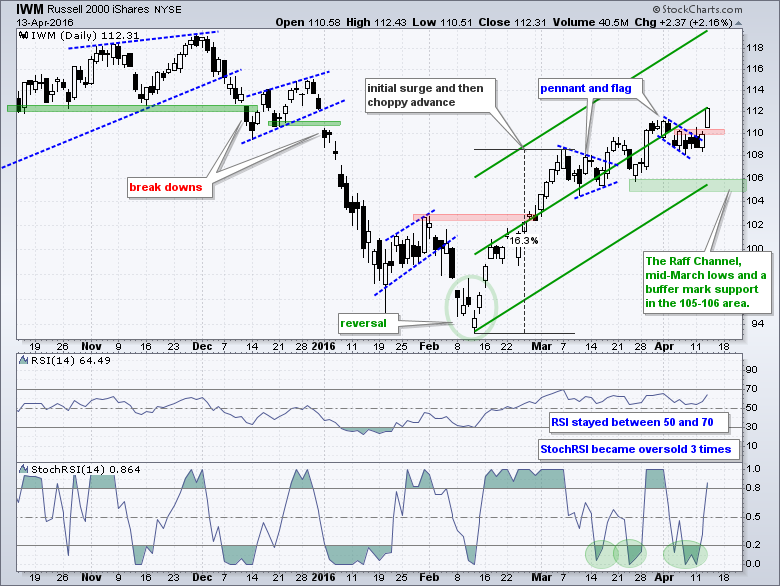
The indicator windows show RSI and StochRSI, which is the Stochastic Oscillator applied to RSI. Developed by Tushard Chande, StochRSI is designed to show when RSI is short-term overbought or oversold. Notice that RSI does not generate very many overbought or oversold signals. StochRSI, on the other hand, is full of signals. We just need to know which way to lean. I look for oversold signals when the bigger trend is up, which is now. A move below .20 signals short-term oversold conditions and a subsequent surge above .50 or .80 signals a bounce. The choice of .50, .80 or 1 depends on your trading style.
Offensive Sectors Lead
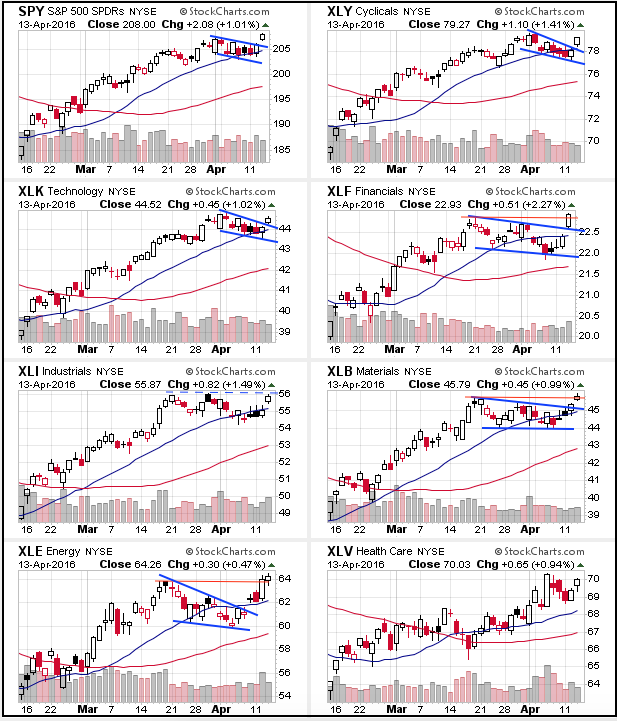
The four offensive sectors led the market on Wednesday: finance, industrials, consumer discretionary and technology. Notice that all four also outperformed SPY. Utilities and consumer staples declined as money moved out of the two defensive sectors. Overall, this is bullish sector action for the broader market. The Technology SPDR (XLK) and Industrials SPDR (XLI) are clear leaders with SCTRs above 85.

The Finance SPDR (XLF) is lagging overall, but note that the ETF was one of three sector SPDRs to hit a new high for the current move, which began in mid February. The Energy SPDR (XLE) and the Materials SPDR (XLB) were the only other two sectors that exceeded their late March or early April highs. CandleGlance charts below show a number of flag/wedge breakouts, which are short-term bullish. The April lows now mark short-term support. Note that medium-term support based on the Raff Regression Channel is a little bit lower on each chart.
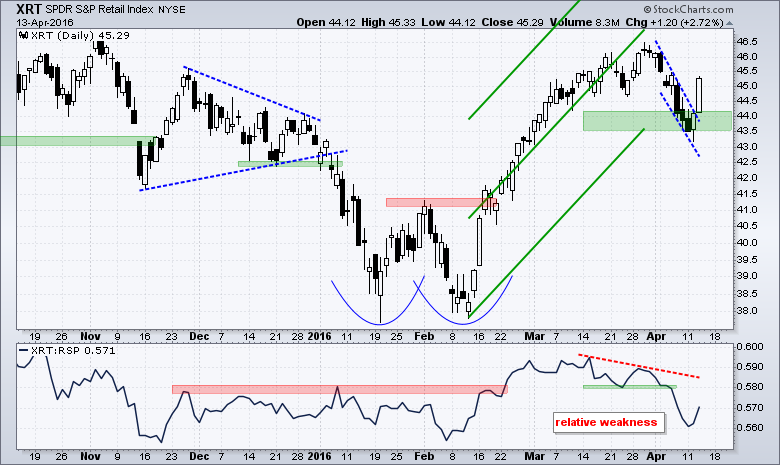
The Regional Bank SPDR (KRE) and the Retail SPDR (XRT) were showing relative weakness from mid March to early April, but both surged and led the market over the last two days. The fact that we did not see bearish resolutions in these two ETFs further affirms that we are in a bull market environment. These bounces also highlight the challenges with marking support and resistance for ETFs, which have dozens of moving parts (stocks). Sometimes we get clean support-resistance breaks with follow through. Sometimes we don't. KRE broke support with a long black candlestick on April 7th, but quickly moved back above this support break and surged above its mid March high on Wednesday. The failed support break is a bear trap. The Retail SPDR (XRT) ultimately held its support level and surged around 4%.

Measuring Risk On-Risk Off - Using charts to quantify stock, economic and credit risk.
PPO Trading Strategy - How to use 3 PPOs to develop a trend-reversion trading strategy.
Long-term Trend Indicators - Using the PPO, EMA Slope and CCI to determine the trend.
ETF Master ChartPack - 300+ ETFs organized in a Master ChartList and in individual groups.
Follow me on Twitter @arthurhill - Keep up with my 140 character commentaries.
****************************************
Thanks for tuning in and have a good day!
--Arthur Hill CMT
Plan your Trade and Trade your Plan
*****************************************


