Bull, Bear or Neutral? // Small and Mid Caps Still Underperforming // Three Big Sector Drags // Breaking Down Sector Weightings // Ranking the Nine Sector SPDRs // Webinar Video ////
Bull, Bear or Neutral?
There is an argument to be made that the S&P 500 SPDR (SPY) is in a big trading range. One only needs a weekly chart to see that the ETF has traded between 210 and 180 for most of the last eighteen months. Technically, this range began when the ETF broke down in August and then bounced back above 200. We have since seen another breakdown and another rebound. It's enough to make one seasick. SPY did hit an all time high in July 2015 and this consolidation could be one big rest within a massive uptrend (says Bobby Bull). No way! SPY has not hit a new high since July and it is a massive top (says Billy Bear). For now, it is just one big consolidation (says Arthur Hill).
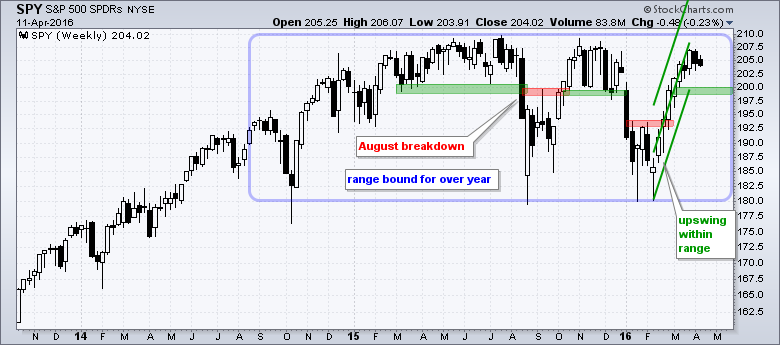
I am watching the swings within the consolidation for the first clues. The current swing is clearly up and I am using a Raff Regression Channel to define this uptrend. The lower line ends in the 199 area and I am adding a buffer to mark a support zone in the 198-200 area. I will stay bullish until a close below 198.
Small and Mid Caps Still Underperforming
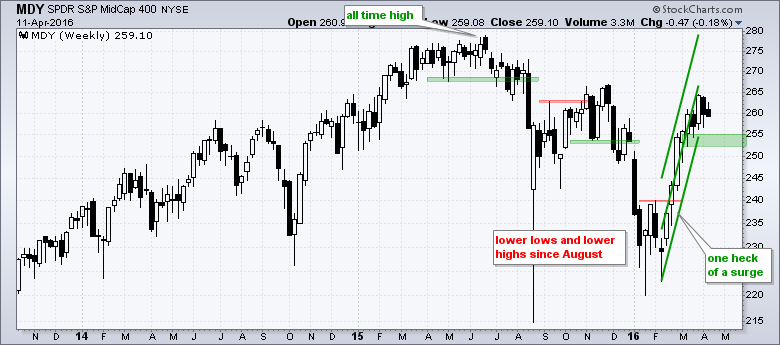
Long-term downtrends become evidence when we move down in market capitalization. The S&P MidCap SPDR (MDY) broke down in August, formed a lower high in November and forged a lower low in January. Despite lower lows and lower highs since summer, the surge over the last few months was quite strong and has yet to reverse. The Raff Regression Channel and mid March low mark support in the 252-255 area. A close below 252 would reverse this upswing and call a continuation of the bigger downtrend.
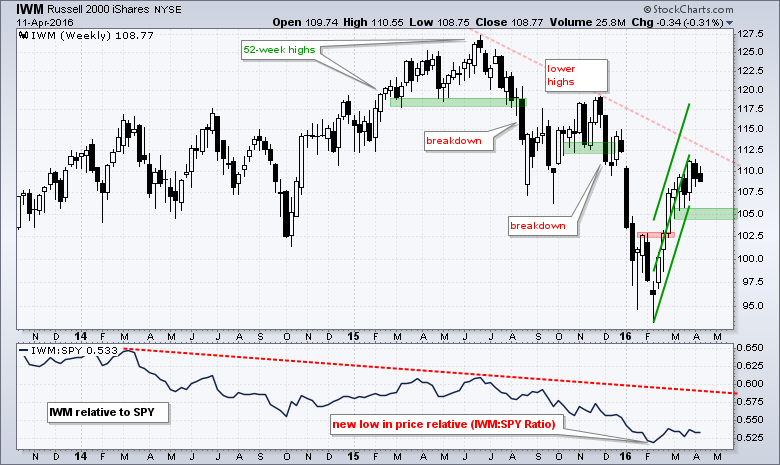
The Russell 2000 iShares (IWM) also sports lower lows and lower highs since summer, but the surge over the last nine weeks is impressive and has yet to reverse. Support is set at 104 (closing basis). The indicator window shows IWM continuing to underperform SPY. Notice that the price relative (IWM:SPY ratio) hit a new low in February and barely bounced the last nine weeks. Large-caps are still the place to be. Overall, chartists can watch the three support levels put forth on these charts for signs of a significant trend reversal.
Three Big Sector Drags
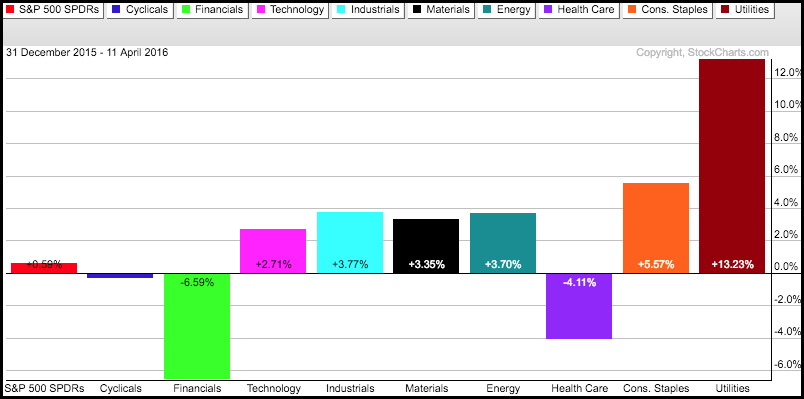
The PerfChart below shows year-to-date performance for SPY and the nine sector SPDRs. Notice that six are up, three are down and SPY is slightly positive. Even though six of nine are up year-to-date, the three losers account for around 43% of SPY and this is creating a big drag on the broader market. No wonder SPY is range bound. The Utilities SPDR (XLU) and Consumer Staples SPDR (XLP) are the clear leaders in 2016. The Finance SPDR (XLF) and the HealthCare SPDR (XLV) are the clear laggards. The Consumer Discretionary SPDR (XLY) is also lagging with a small loss.
Breaking Down Sector Weightings
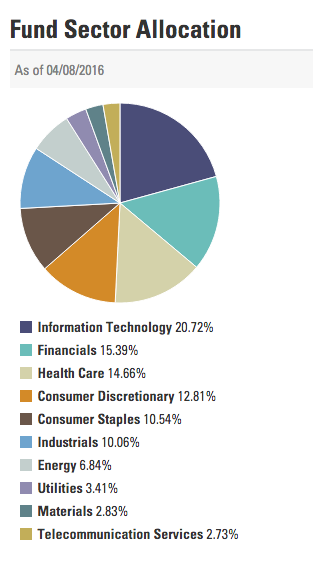
The S&P 500 can be broken down into nine sector SPDRs and we can assess the state of the market by analyzing these nine sectors. Using a simple majority, at least five of the nine sectors need to be in uptrends to support an uptrend in the S&P 500. Chartists can also use sector weightings to form a majority. The image below comes from spdrs.com and shows the weightings for each sector. Technology is by far the largest sector and accounts for over 20% of SPY. Finance and healthcare account for around 15% each. Consumer discretionary, consumer staples and industrials range from 10 to 13 percent. These are clearly the six biggest, and most influential, sectors for SPY. Energy, utilities and materials account for less than 7% each. Telecommunications is also listed, but most telecom stocks are part of the Technology SPDR (XLK), which gives XLK and even bigger weighting in reality.
Ranking the Sectors
The SPY chart above showed a trading range and the swing within this trading range is up. This swing started with the mid February reversal is about eight weeks old (40 trading days). Rather than show weekly charts for the sectors, I am just going to show daily candlestick charts and focus on immediate uptrend. All nine are in uptrends, but some uptrends are stronger than others. XLK, XLP and XLU are the leaders because they hit 52-week highs just two weeks ago. XLI gets fourth place because it almost hit a 52-week high in March. XLE, XLF and XLV are still the weakest overall because they remain well below their November highs. XLY and XLB are somewhere in between the leaders and the laggards. Despite lagging, all are in uptrends and the green zones mark support. The broader market is in good shape until we start to see support breaks in the key sectors.
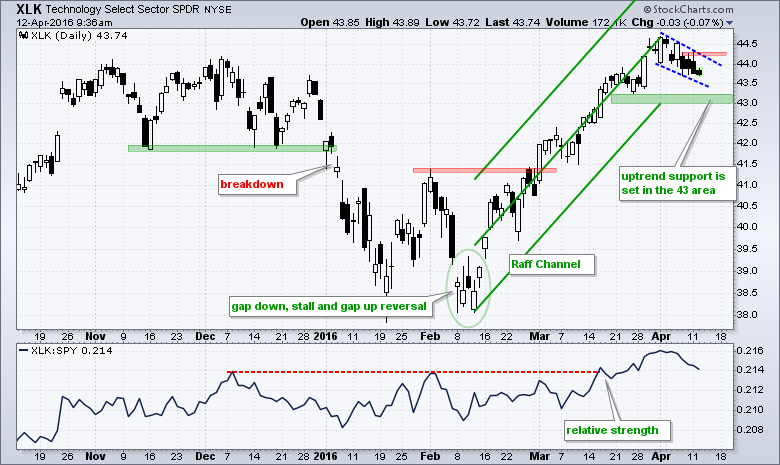
The Technology SPDR (XLK) has support in the 43 area, which may be a bit tight. A bullish flag/wedge could be forming the last eight days and a breakout would be short-term bullish.
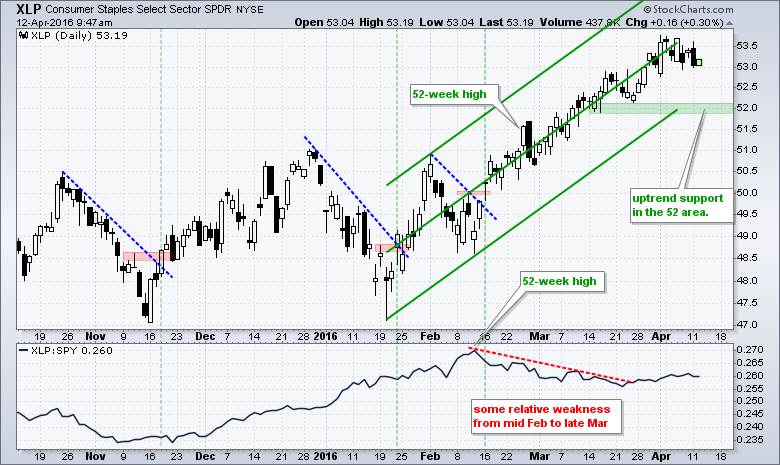
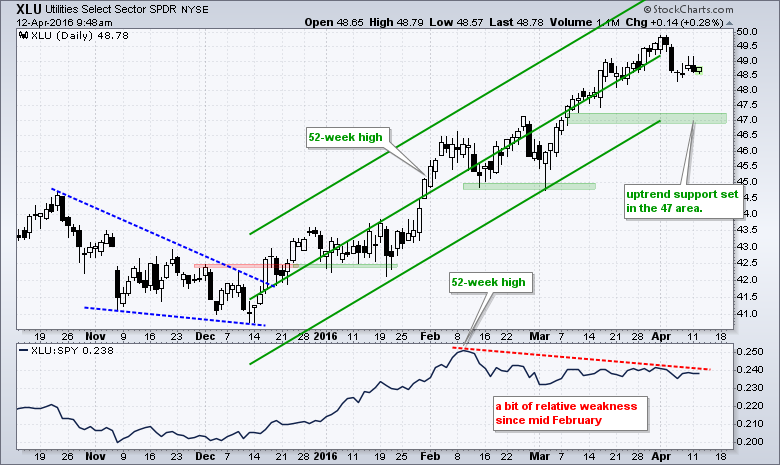
The Utilities SPDR (XLU) and the Consumer Staples SPDR (XLP) continue to trend higher. Relative strength has tailed off the last two months because the broader market moved higher. Nevertheless, XLU and XLP hit new price highs two week's ago and continue to show chart strength.
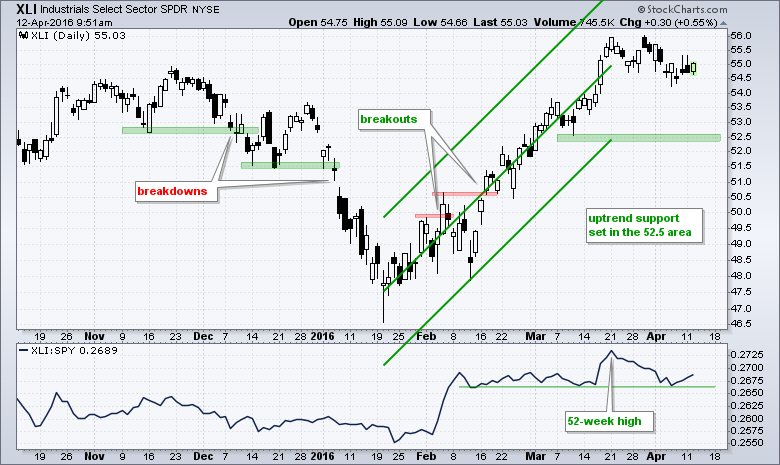
The Industrials SPDR (XLI) almost hit a new high in late March, but fell a few cents short. The Raff Regression Channel is quite wide and this is why uptrend support is set in the 52.50 area.
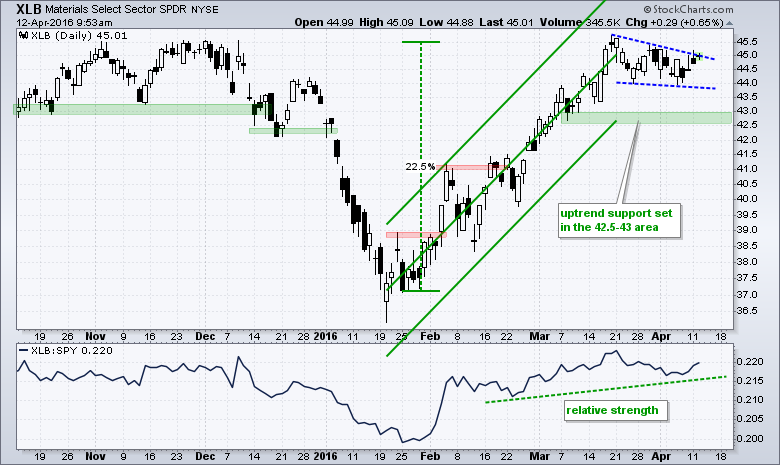
The Materials SPDR (XLB) is up the most of the nine sectors since mid January. A bullish wedge formed over the last few weeks and a breakout here would continue the uptrend.
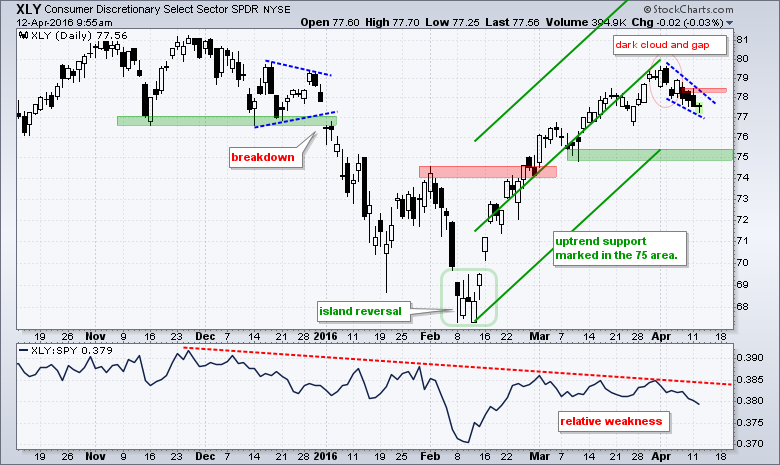
 The Consumer Discretionary SPDR (XLY) is a concern because it continues to underperform the broader market. Notice that the price relative (XLY:SPY ratio) peaked six weeks ago and has been trending lower since November. Despite relative weakness, the immediate trend is up and a small bull wedge could be taking shape. A breakout would be short-term bullish.
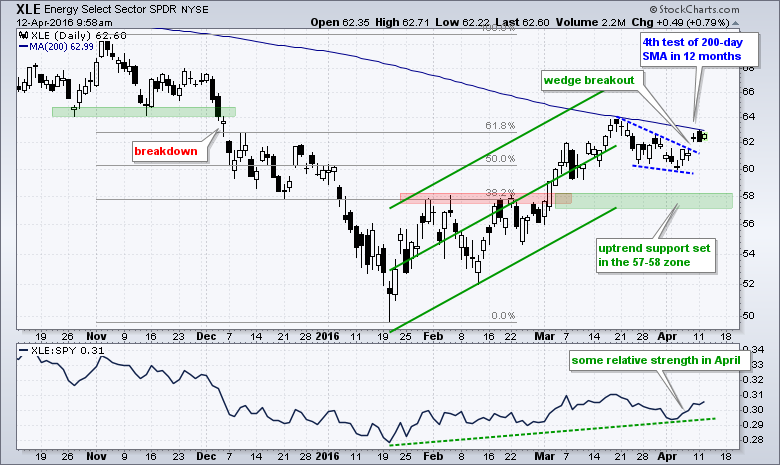
 The Energy SPDR (XLE) shows relative strength since mid January, but relative weakness over the past year. You got to start somewhere. Uptrend support is set in the 57-58 area for now. On the price chart, the ETF just broke wedge resistance with a surge last week and is challenging the falling 200-day for the fourth time in a year.
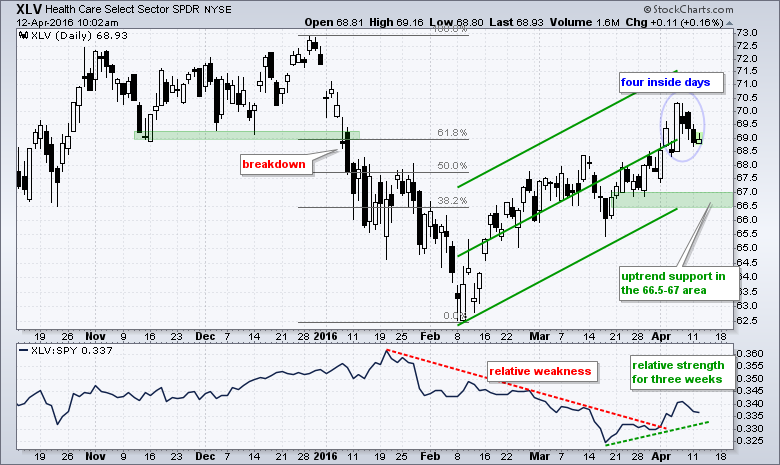
 The HealthCare SPDR (XLV) was lagging badly in mid March, but got some shock treatment and surged over the last five weeks. I am marking uptrend support in the 66.5-67 area.
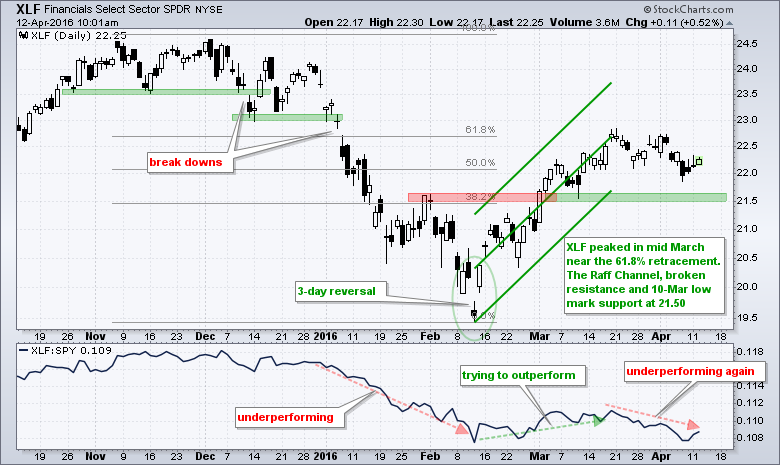
 The Finance SPDR (XLF) gets last place on this list because the price relative hit a new low in early April and the ETF remains well below its November high. The immediate trend, however, is still up with support marked in the 21.5 area. REITs are keeping XLF afloat.
Bear Market Bounces - Understanding Bear Market Patterns, Signals and Retracements.
Measuring Risk On-Risk Off - Using charts to quantify stock, economic and credit risk.
PPO Trading Strategy - How to use 3 PPOs to develop a trend-reversion trading strategy.
Long-term Trend Indicators - Using the PPO, EMA Slope and CCI to determine the trend.
ETF Master ChartPack - 300+ ETFs organized in a Master ChartList and in individual groups.
Follow me on Twitter @arthurhill - Keep up with my 140 character commentaries.
****************************************
Thanks for tuning in and have a good day!
--Arthur Hill CMT
Plan your Trade and Trade your Plan
*****************************************


