High-Low Percent Confirms Bullish Environment // Pullbacks Remain Shallow // IWM Forms Bullish Continuation Pattern // Risk Indicators Soften // Treasury Bond ETFs Break Out // Oil Corrects and Breaks Out // Gold Challenges Flag Resistance // Catching Up ////
High-Low Percent Confirms Bullish Environment
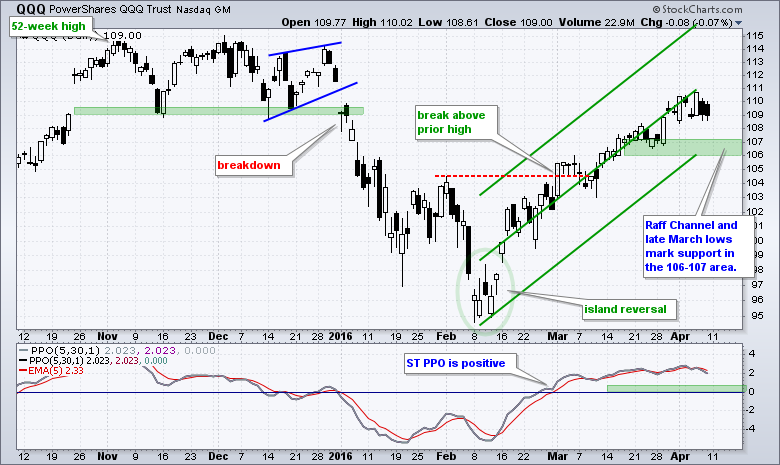
I am back in the saddle and not much has changed in the stock market over the last two weeks. Note that the bulk of the evidence has been bullish for stocks since early March and this evidence remains bullish. QQQ, SPY and IWM broke out in early March and there was a bullish breadth thrust on March 3rd. The bullish breadth thrust occurred when the 10-day EMA of S&P 1500 AD Percent ($SUPADP) moved above +30%. S&P 1500 High-Low Percent ($SUPHLP) did not trigger a bullish signal in early March, but finally confirmed with a move above +10% on March 30th. Note that this indicator has not been above +10% since June 23, 2015. There may be pockets of weakness within the stock market, but the pockets of strength outweigh the pockets of weakness right now and this keeps the broad market environment bullish.
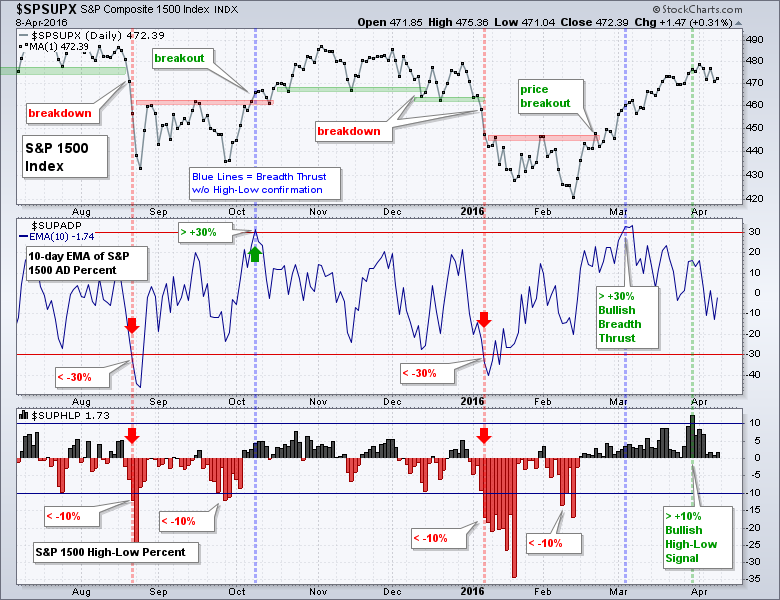
At this point, I remain bullish on stocks because my key price and breadth indicators are bullish. As usual, I do not know how long this bullish stance will last or how far the up trend will extend. It will end when it ends and not a moment sooner. Here are three things to watch. First, look for support breaks in SPY, QQQ and IWM. Second, look for a bearish breath thrust with a move below -30%. Third, watch for a move below -10% in the 10-day EMA of S&P 1500 High-Low Percent.
Pullbacks Remain Shallow
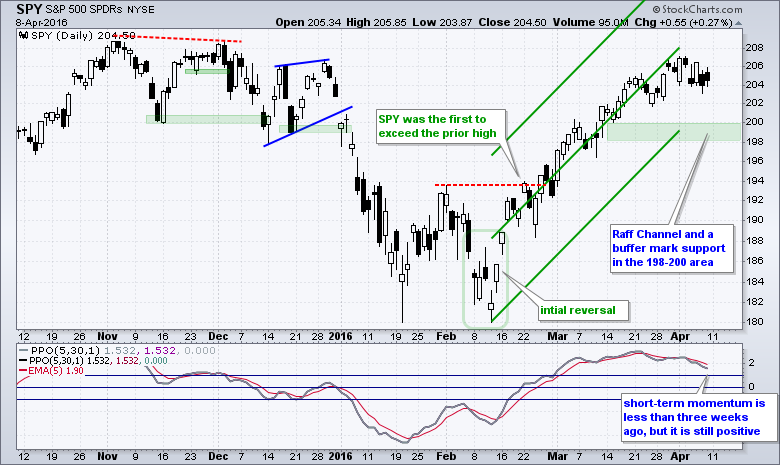
QQQ, SPY and IWM started uptrends with reversals in mid-February and continued with breakouts in late February (SPY) and on March 1st (QQQ, IWM). Using the mid February low as the starting point, SPY has been trending higher for 39 trading days and the ETF is up just over 12%. Notice that pullbacks since the mid February reversal have been 3 days or less and declines have been less than 1.5%. There is not much selling pressure out there right now. It is tempting to read into the candlestick action and waning upside momentum, but the trend is clearly up for SPY and I am marking support in the 198-200 area. Note that this support zone is 2 points higher than my prior support zone. I will simply raise support if/when SPY records another new high and stay bullish as long as the support holds.
IWM Forms Bullish Continuation Pattern
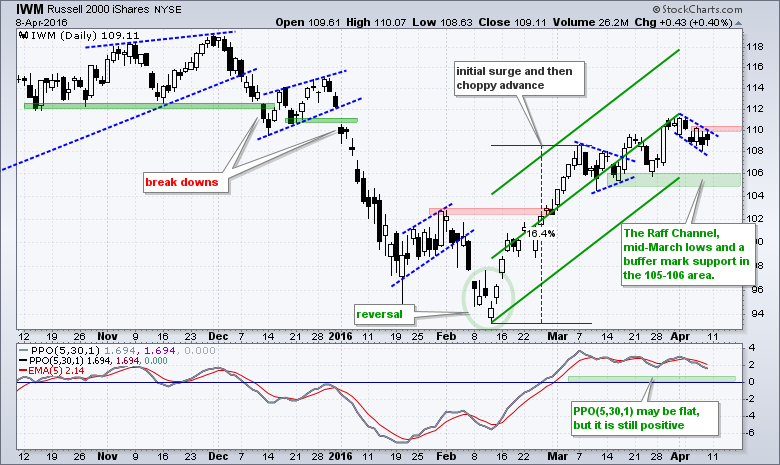
IWM has been lagging SPY since mid March, but remains in an uptrend overall and sports a bullish flag, which is a continuation pattern. First, notice that IWM surged around 16% in 16 trading days (11-Feb to 7-Mar). This advance continued the last few weeks, but at a much slower pace. IWM is up just .43% from 7-Mar to 8-Apr (23 trading days). A slower uptrend, however, is not the same as a downtrend. In fact, it is actually quite normal for the advance to close because 16% in 16 days is unsustainable. This trend remains up as long as the support zone in the 105-106 area holds. Short-term, I see a potentially bullish flag over the last five trading days. A breakout at 110.2 would reverse this short-term slide and signal a continuation of the late March pop.
Risk Indicators Soften
There is some concern when I look at some risk indicators in the market. These risk indicators are ratio charts with the riskier asset as the numerator and the safer asset as the denominator. The risk appetite is strong when the ratio rises and weak when the ratio falls. For example, the S&P 500 High Beta ETF (SPHB) has been underperforming the S&P 500 High Quality ETF (SPHQ) since early March as the SPHB:SPHQ ratio falls. The chart below shows eight ratios with five falling, two rising and one flat. This is net negative. Elsewhere, the EW S&P 500 ETF (RSP) is underperforming the S&P 500 SPDR (SPY) since mid March and the Russell 2000 iShares (IWM) is underperforming the Russell Top 50 ETF (XLG) since early March. Basically, riskier stocks are lagging safer stocks over the last few weeks.
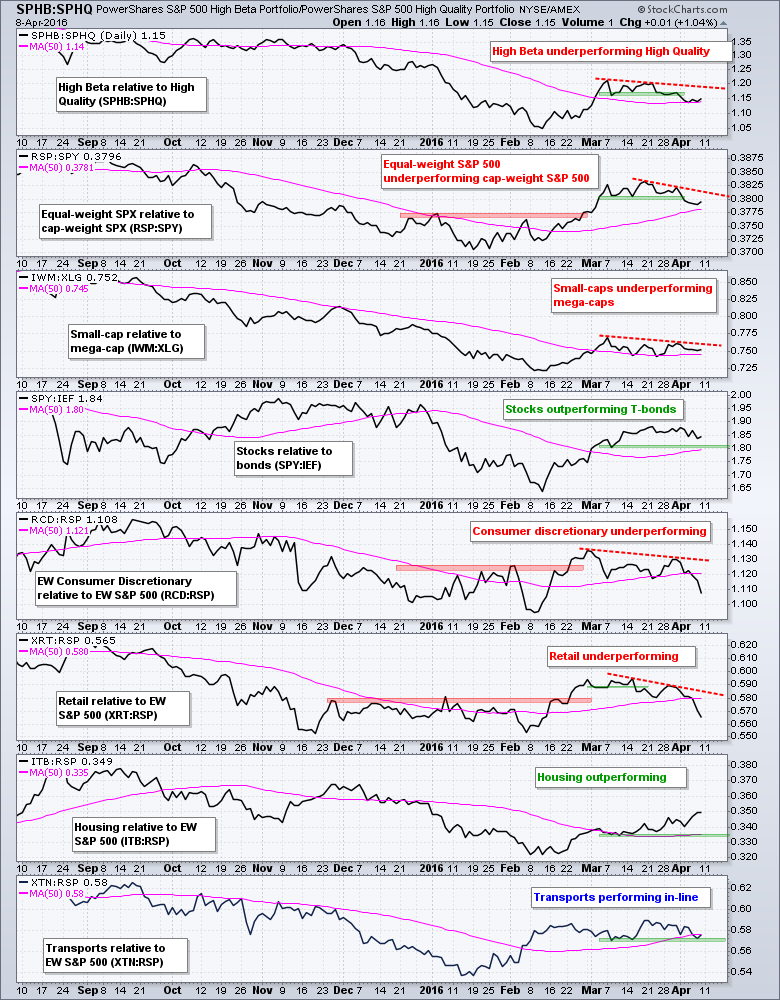
On the plus side, the S&P 500 SPDR (SPY) is still outperforming the 7-10 YR T-Bond ETF (IEF) and the Home Construction iShares (ITB) is outperforming the broader market. Overall, these risk indicators suggest that the appetite for relative safety is increasing. This is a potential negative for stocks, but I would not turn outright bearish until the major index ETFs break support and actually reverse their uptrends.
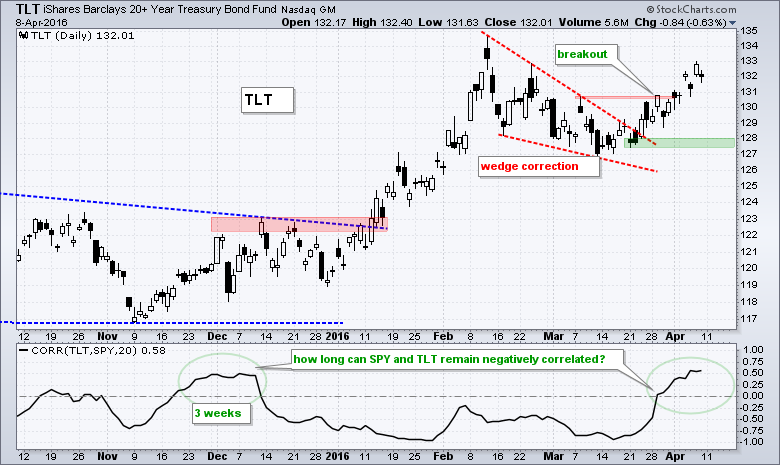
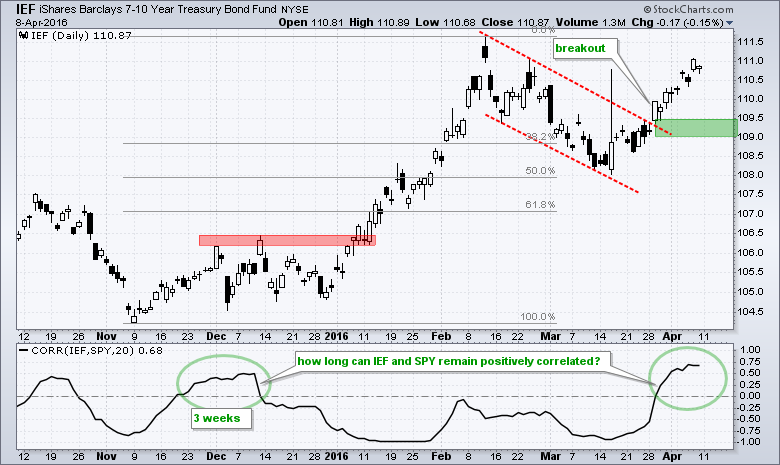
Treasury Bond ETFs Break Out
The 7-10 YR T-Bond ETF (IEF) and the 20+ YR T-Bond ETF (TLT) broke out in late March with strong moves over the last few weeks. This is a bit perplexing because stocks and bonds are usually negatively correlated, which means they move in opposite directions. The indicator windows show the Correlation Coefficients turning positive in late March. These indicators were positive for around three weeks in late November and early December. The stock market started to weaken when the Correlation Coefficients turned negative again in mid December. As with the risk indicators, I am concerned about stocks because of the recent breakouts in IEF and TLT, which are safe-haven assets. The green zones mark the first level to watch for a failed breakout.
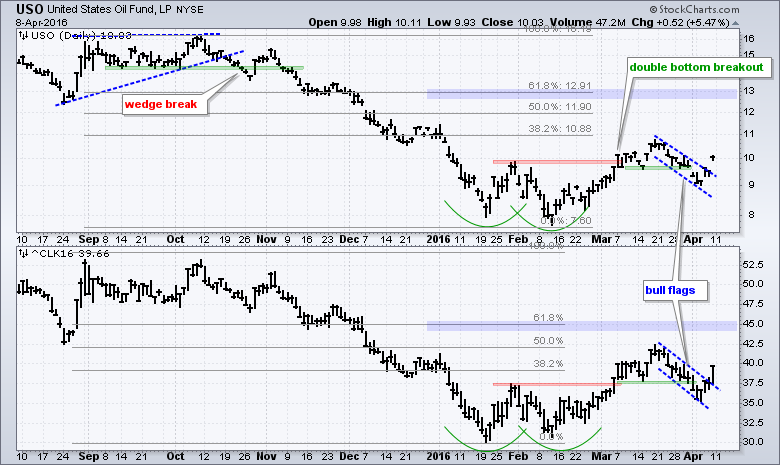
Oil Corrects and Breaks Out
The USO Oil Fund (USO) and May Crude (^CLK16) broke out of falling flag patterns with a surge the last few days. Overall, oil formed a double bottom in January-February and broke out in early March. The flag pullback moved below the breakout zone and then reversed as prices surged above flag resistance last week. This signals a continuation of the prior advance (mid-Feb to mid Mar) and targets a move to the 61.8% retracement area (~45 for May crude and 13 for USO).
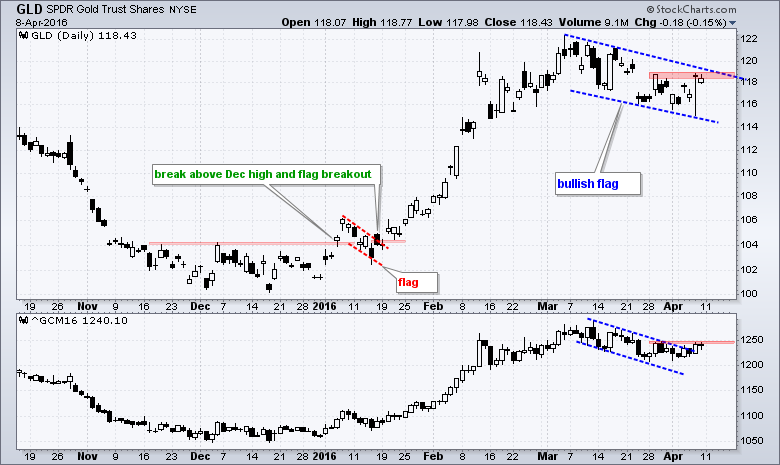
Gold Challenges Flag Resistance
The Gold SPDR (GLD) surged around 20% from mid-December to early March and then corrected with a falling flag the last five weeks. This is a bullish continuation pattern and a breakout at 119 would signal a continuation higher. A falling flag represents a correction after a sharp advance. It is a pattern that alleviates overbought conditions and sets the stage for the next leg higher. Gold futures are up sharply this morning and we could see a breakout today.
Catching Up
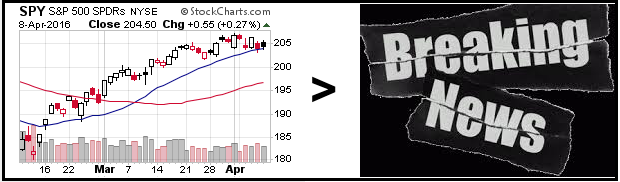
This is my first day back and I am pouring over the charts to catch up. I will cover the sectors, key industry group ETFs and some stocks in Tuesday's webinar. I watched prices periodically while on vacation, but did not see any news. No market news, no election coverage, no national news and no international news. Except for some sports and local weather, it was pretty much a news blackout for two weeks and I loved it. In fact, it gives me newfound appreciation for charts and disdain for the news, or rather noise. Forget the fundamentals and focus on the charts! The breaking news image comes from Greg Morris post on breaking news/noise.
Family vacation was on the Riviera Maya, which is on the Yucatan peninsula. We took in Mayan ruins in Coba and Tulum, a nature reserve with spider monkeys and various restaurants. The fresh fish was always outstanding and the locals were very friendly. The seawater of Akumal and Tulum was clear, warm and full of life with the barrier reef nearby. Akumal, in particular, is a fantastic place for those loving sun, sea and good fun.
Measuring Risk-On Risk-Off - Using charts to quantify stock, economic and credit risk.
PPO Trading Strategy - How to use 3 PPOs to develop a trend-reversion trading strategy.
Long-term Trend Indicators - Using the PPO, EMA Slope and CCI to determine the trend.
ETF Master ChartPack - 300+ ETFs organized in a Master ChartList and in individual groups.
Follow me on Twitter @arthurhill - Keep up with my 140 character commentaries.
****************************************
Thanks for tuning in and have a good day!
--Arthur Hill CMT
Plan your Trade and Trade your Plan
*****************************************


