SystemTrader // Dissecting the Best Six Months Pattern // Historical Numbers Confirm // Shorting the Market is a Challenge // What is the deal with October? // Reducing the Dreaded Drawdown // Testing the 50-200 Cross Since 1950 // Final Thoughts // .........
May is approaching and this means the stock market is entering its weakest six-month period. With this in mind, I decided to run some tests to see how the six-month seasonal pattern performed in the past. Part performance, of course, does not guarantee future performance. Using the S&P 500 since 1950, I will test the traditional six-month strategy and a slightly modified version. I will then add a simple timing mechanism to see if we can improve the results. Remember, we are not always looking for the highest return. Investors should also consider the maximum drawdown and the risk-adjusted return.
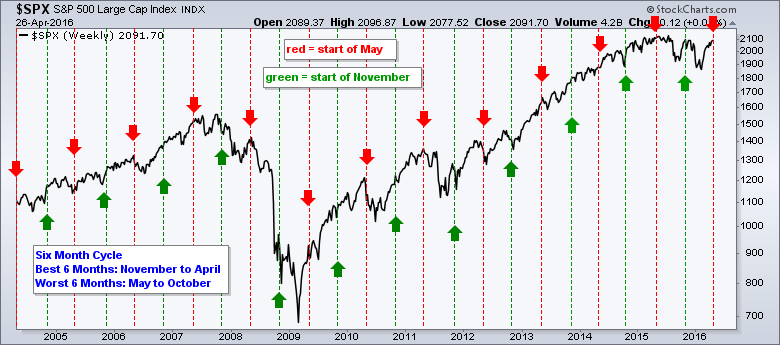
Yale Hirsch, creator of the Stock Traders Almanac, discovered the best six months strategy. By the way, the Stock Traders Almanac is a great resource, as is the website and blog run by Jeffrey Hirsch. According to the almanac, November to April is the best six-month period for the stock market and May to October is the worst. The chart below shows the beginning and end of each period over the last 12 years. The red lines mark the start of the weakest six-month period and the green lines mark the start of the strongest six-month period.
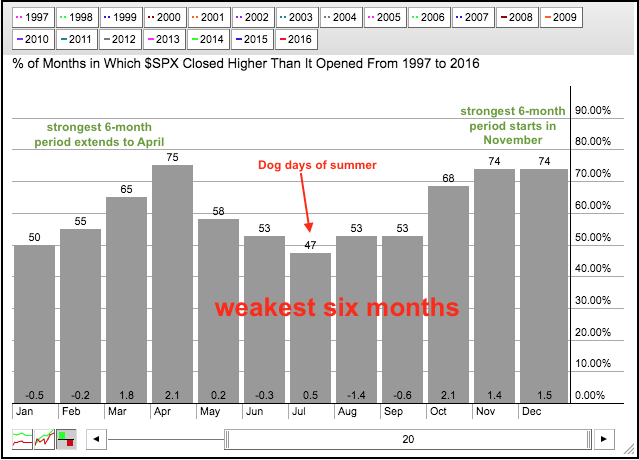
The weakest six-month period includes the dog days of summer and September, which is traditionally a weak month for the S&P 500. The seasonal chart below shows monthly performance for the S&P 500 from 1997 to 2016. January, June, July, August and September were the weakest months. October, November, December, March and April were the strongest months. Despite its reputation, October is more positive than negative and the market has a habit of bottoming in October. More on that later.
Historical Numbers Confirm the Best Six Months
It is hard to get an idea of historical performance by looking at the charts so I ran some backtests. Note that I am using Amibroker for these tests. I first ran a long/short test for the S&P 500 since 1950. Long positions were initiated on November 1st and short positions were closed. Similarly, longs were closed on May 1st and shorts were initiated.
As you can see from the table below, the attempt to play both sides of the market was not a roaring success. The long-short six-month system (red) produced a paltry annual return of 4.38% with a maximum drawdown of -42.5%. The MDD is the biggest loss incurred by the system at any given time. The system recovered from this loss, but it would have been tough to sit through such a drawdown. For reference, buying the S&P 500 in January 1950 and holding until late April 2016 produced a 7.56% annual gain and an MDD of -57%. The big drawdowns occurred at the end of bear markets (think October 2002 and March 2009).
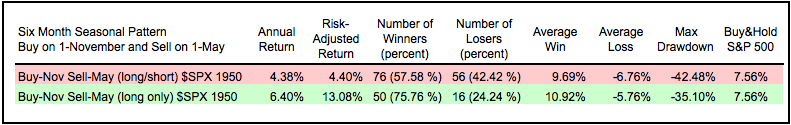
Performance for the six-month seasonal pattern greatly improves if we just eliminate short positions. The green shading on the table above shows the annual return jumping to 6.4%, the winning percent increasing to 76% and the MDD improving to -35%. The annual return is still less than buy and hold, but the risk-adjusted return is 13% because this system was out of the market half the time. In other words, the system was exposed to risk (S&P 500) for just six months of the year.
Shorting the Market is a Challenge
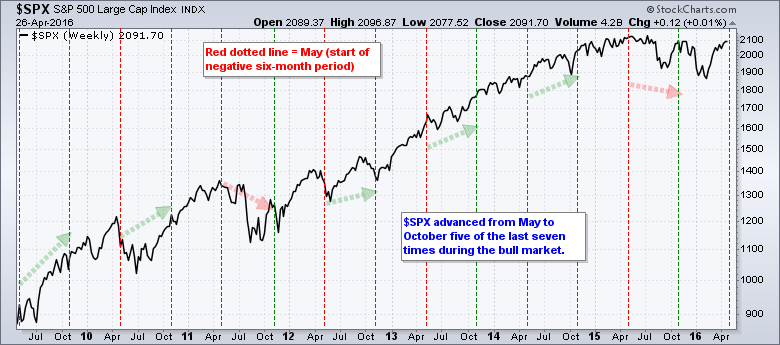
Short positions are problematic for a long-term strategy using the S&P 500. Why? Because the S&P 500 has a long-term upward bias, which is proven with the buy and hold performance. Since 1950, the average gain from May to October was around 1%. Despite being the weakest six month period, it would be hard to make money shorting the market during this timeframe. The chart below shows the S&P 500 advancing from May to October five of the last seven times since 2010. Even negative seasonal patterns produce gains in a bull market.
What is the deal with October?
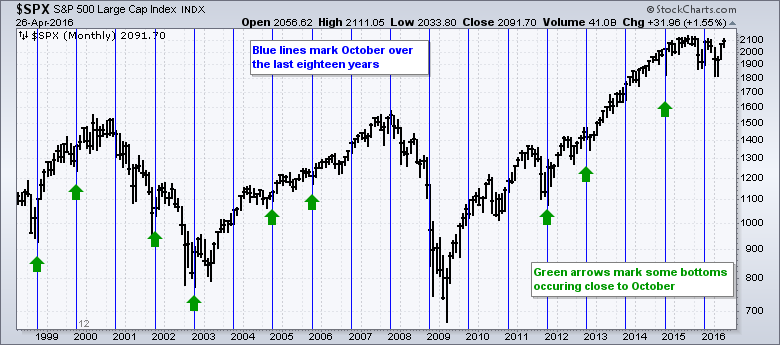
For some reason, the stock market likes to bottom around October, especially in bull markets. The chart below shows the S&P 500 over the last eighteen years with the blue lines marking October. The green arrows mark instances when the S&P 500 bottomed in the September-October period and moved higher. October bottoms did not work well during the bear markets of 2000-2002 and 2007-2008, but there are several key lows around October at other times.
Sy Harding noticed this October phenomenon as well and tweaked the six-month seasonal pattern by starting it in mid October. There is something here because we can improve the six-month seasonal system by starting the bull cycle in October instead of November. Let's call it the seven-month seasonal strategy. The table below shows the backtest results for the six-month strategy in the top row and the seven-month strategy with the green shading.
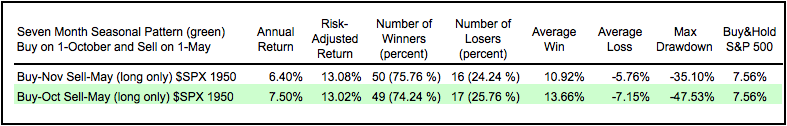
Buying on October 1st instead of November 1st adds an extra percentage point per annum. The seven-month strategy returned 7.5% annually and this is much better than 6.4% for the best six months strategy (November-April). The winning percentage and risk-adjusted return are similar for both periods, but the Max Draw Down (MDD) is exceptionally high at -47.5% for the seven-month strategy.
Reducing the Dreaded Drawdown
All trading systems and strategies have drawdowns and we must seek ways to minimize these drawdowns. The seven-month seasonal strategy is open to big drawdowns because it lacks a timing mechanism to identify the trend. This means it can go long even when the S&P 500 is in a downtrend. We need some sort of market timing mechanism to confirm the underlying trend and limit drawdowns. The list of timing techniques is endless so I am just going to add a simple moving average cross to the strategy. In fact, I am going to use the most famous moving average pair of all time: the 50-day SMA and the 200-day SMA.
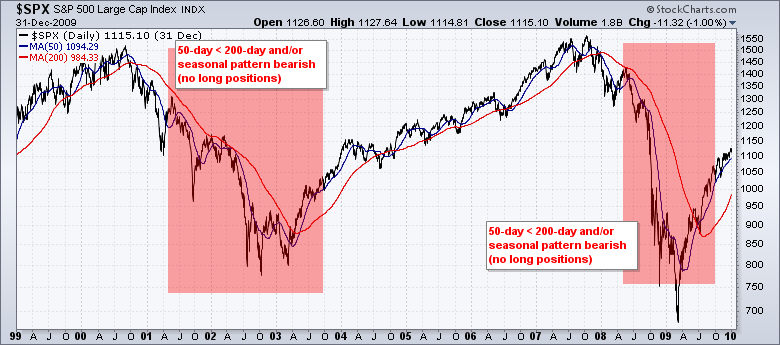
Here are the signals. Buy when the seven-month seasonal pattern is bullish and the 50-day SMA is above the 200-day SMA. Sell when the seven-month seasonal pattern is bearish and the 50-day SMA is below the 200-day SMA. This timing mechanism will keep investors in the market when the trend is up and the seasonal pattern is bearish. Similar, it will keep investors out of the market when the seasonal pattern is bullish and trend is down. The chart below shows that this filter would have kept investors out of the market from May 2001 to September 2003 and from May 2008 until September 2009.
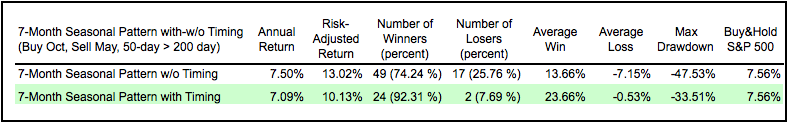
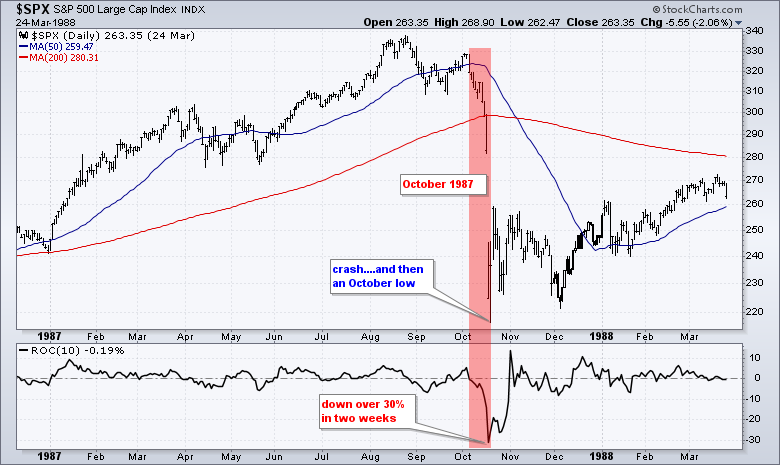
As the table below shows, the annual gain for this system is not better than the basic seven-month seasonal strategy, but the max drawdown improved because the system exited during the bear markets. The MDD was 33.51% and this occurred in October 1987 (black Monday). Note that the S&P 500 fell over 30% in two weeks in October 1987. The second largest MDD was 27.77% in 2001 (911). The third largest drawdown was 20.51% and this occurred during the 2008 decline.
Testing the 50-200 Cross Since 1950
I don't always know where I will end up when I start testing a theory, indicator or system. After the testing above, it only makes sense to test the S&P 500 using just the 50-day SMA and 200-day SMA. Maybe we don't even need the six-month or seven-month seasonal patterns. Perhaps, a trend or timing mechanism is all that is really needed. We can see that buy and hold is pretty darn good with a 7.5% annual return, but the drawn downs are big, too big. The shaded area on the table below shows the results for a long only system using the 50-day and 200-day moving averages. The red area shows the results for a long-short system, which did not perform as well.
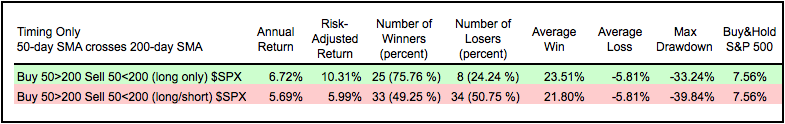
The results are pretty good for an armchair system. The annual return was 6.72%, the risk-adjusted return was just over 10% and there were 76% winners. Again, the MDD was 33.51% because of October 1987. For those not old enough to remember, the S&P 500 fell over 30% in two weeks and there was not a lot of time to get out. The S&P 500 did, however, bottom in October 1987 and moved higher the next few years. Outside of October 1987, the MDD for this system was 20.5%.
Final Thoughts
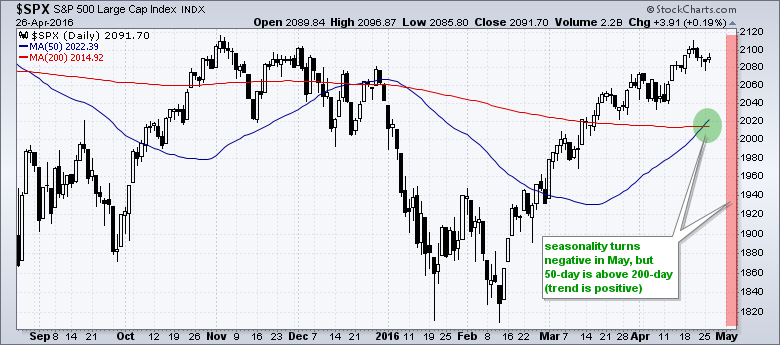
For those keeping score at home, the chart below shows 50-day SMA for the S&P 500 moving above the 200-day earlier this month. Even though the worst five-month period begins in May, these key moving averages point to an uptrend and this matters more than seasonality (IMHO).
Here are a few more takeaways from the backtest results. At the end of the day, it seems that using a 50-day/200-day moving average crossover system is just as effective as the seasonality system. In fact, I am not sure if the six-month and seven-month season patterns add enough value to be considered. Nevertheless, the test results show that the six-month and seven-month seasonal patterns are valid. Stocks really do perform best from October to April and worse from May to September. Chartists can improve the risk-adjusted performance and reduce drawdowns by adding a simple timing mechanism. And finally, it is usually best to avoid short positions and just exit the market on a sell signal.
******************************
Please send any comments or suggestions via the feedback form at the bottom.
****************************************
Thanks for tuning in and have a good day!
--Arthur Hill CMT
Plan your Trade and Trade your Plan
*****************************************


