Isolating the Key Trend in the S&P 500 // Breadth Indicators Near Moment-of-truth // New Highs Still Outpacing New Lows // The Weight of the Evidence Is.... // Using Breadth and Price Action for Sectors // Sector Summary and Ranking Table // Friday Food for Thought //// .......
Isolating the Key Trend in the S&P 500
My first task as a chartist is to determine the dominant trend for the stock market. Unfortunately, this is not as clear-cut as it may seem because we have different trends on different timeframes. Starting with the S&P 500, I see a big trading range over the last eighteen months (~1850 to 2125). There is also a two week downtrend because the index moved lower the last ten days. Medium-term, the index moved into the upper quarter of the long-term range with the surge from mid February to mid April. I like the middle. Despite this large range, I am most interested in the medium-term trend and trend changes.
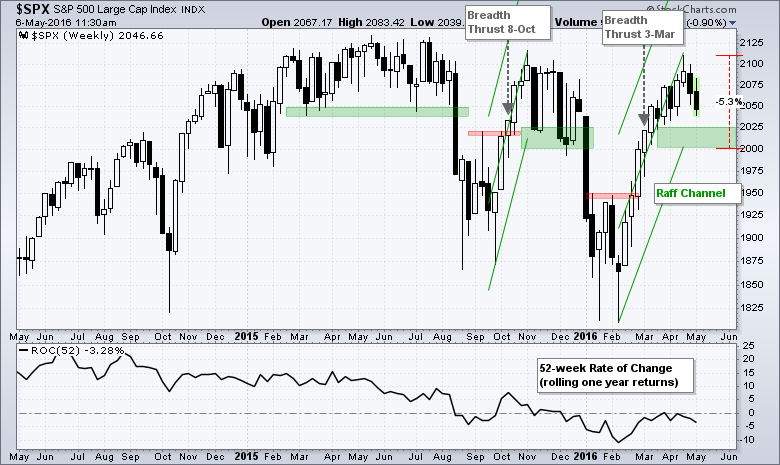
As far as I am concerned, the price breakout in late February and breadth thrust in early March were bullish and these signals have yet to be negated with counter signals. I will cover the breadth signals below and mark chart support now. I am looking for a level that will make the bulls (me) cry uncle. Using the Raff Regression Channel and April lows, I will mark support in the 2000-2030 area. A decline into this zone would be 4-5%, which is actually quite normal for a pullback. I will re-evaluate my bullish stance should the S&P 500 close below 2000 on a weekly basis.
The indicator window shows the 52-week Rate-of-Change, which is basically the one year rolling return for the S&P 500. Investors who bought the S&P 500 one year ago would be down around 3% right now. Overall, investors holding for one year periods enjoyed stead gains until August 2015. After a blip into positive territory in October-November, the one year rolling return has been mostly negative since December.
Mid-caps and Small-caps Hold the Lead
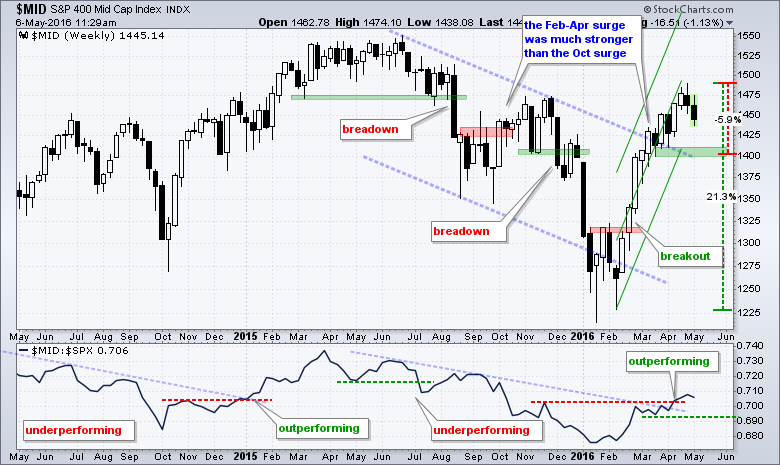
The S&P MidCap 400 exceeded its November high recently and is currently outperforming the S&P 500. The index broke out in mid February and a breadth thrust triggered in early March. $MID broke out of the falling channel in March and forged a higher high in April. As with the other indexes, $MID was ripe for a corrective period after a double digit surge and a pullback is materializing right now. The Raff Regression Channel, April low and a buffer mark support at 1400. A weekly close below this level would call for a re-evaluation of my bullish stance. Note that a 4-5% decline from the recent highs would extend to the low 1400s and this would be perfectly normal for a correction.
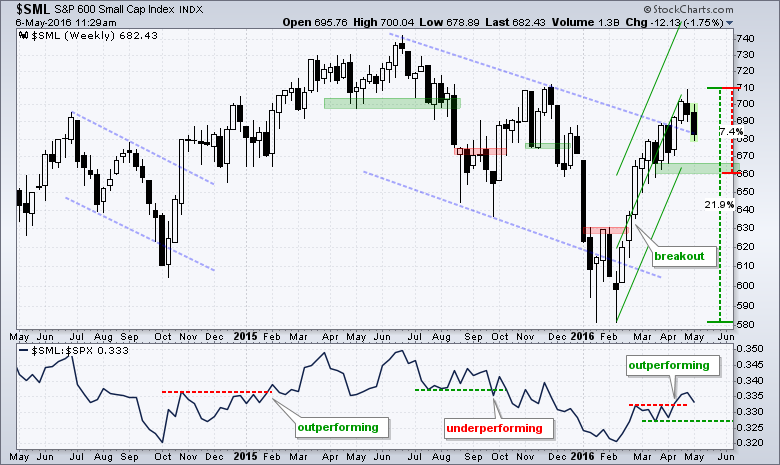
The S&P Small-Cap 600 is also outperforming the S&P 500 and remains in a strong uptrend since the February breakout and early March breadth thrust. Key support is set in the 660-670 area. Overall, we now have three support levels to watch. The S&P 500, S&P MidCap 400 and S&P Small-Cap 600 cover the market as a whole and we can watch these three for signs of a significant breakdown. Support breaks in two of the three would call for a serious re-evaluation.
Breadth Indicators Near Moment-of-truth
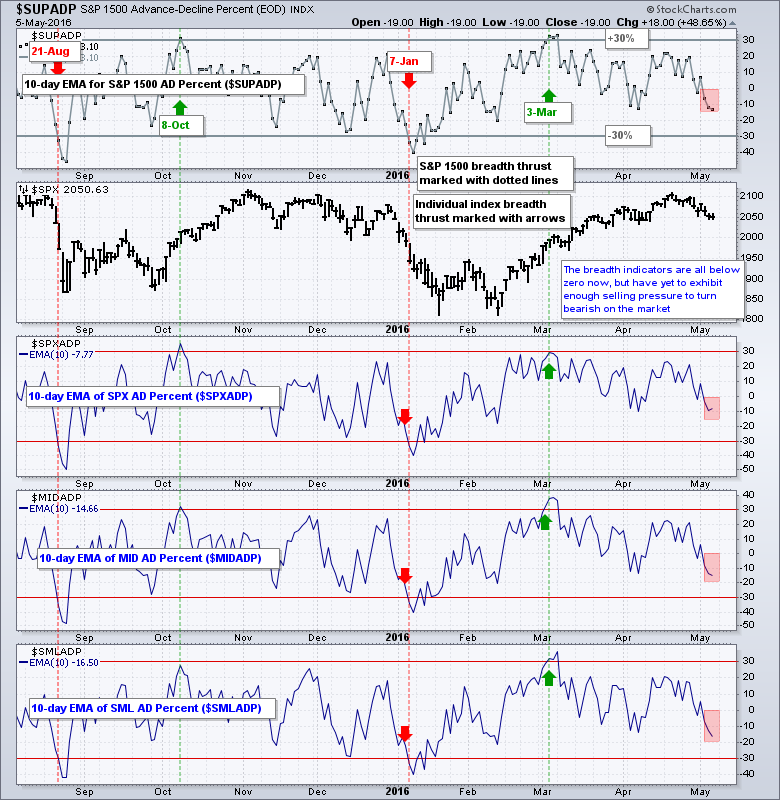
The next chart shows the breadth thrust indicators for the S&P 1500, S&P 500, S&P MidCap 400 and S&P Small-Cap 600. The 10-day EMAs for AD Percent are all below zero (negative), but have yet to cross below -30%, which would trigger a bearish breadth signal. Again, I am not looking to turn bearish at the first sign of selling pressure. I am trying to separate mild selling pressure associated with a correction from strong selling pressure associated with a significant trend change. I view current weakness as corrective until these indicators start breaking below -30%. I left out the Nasdaq 100 because this index is not broad enough to be representative of the market as a whole.
New Highs Still Outpacing New Lows
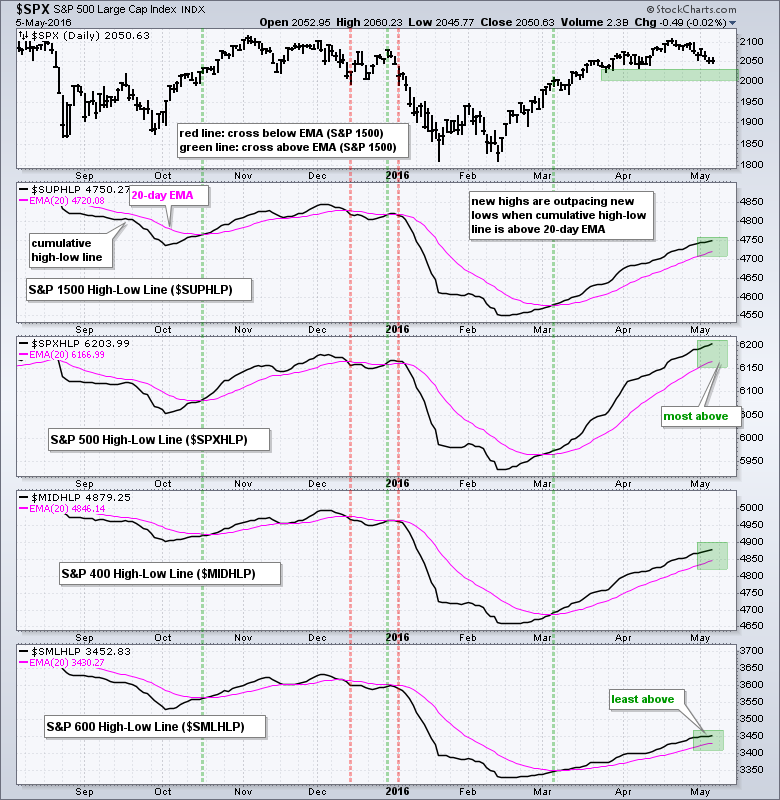
Instead of showing High-Low Percent as a histogram, I am going to show the High-Low Percent indicator in cumulative form, which is like an AD Line. The broad market indicator is the S&P 1500 High-Low Line ($SUPHLP) with the 20-day EMA (pink). New highs are outpacing new lows as long as this line is rising and above the 20-day EMA. New lows gain the edge when the High-Low Line moves below the 20-day EMA. The S&P 1500 High-Low Line moved above its 20-day EMA in early March and remains above. Breaking down the index, we can see that all three High-Low Lines are above their 20-day EMAs and the S&P 500 is the furthest above (strongest).
A Weight of the Evidence Approach
We now have three price charts and two breadth indicators to watch for signs of a meaningful trend change. As the table below shows, the evidence turned net bullish in early March and we have yet to see enough selling pressure to turn this evidence bearish. We have seen some weakening in breadth over the last four weeks, but I am not going to speculate on when a signal may materialize. Instead, I will stick to good old Dow Theory: the trend (evidence) is bullish until proven otherwise. As long as the evidence remains bullish, I will expect bullish resolutions to pullbacks and focus on bullish setups for sectors, industry groups and stocks.
Using Breadth and Price Action for Sectors
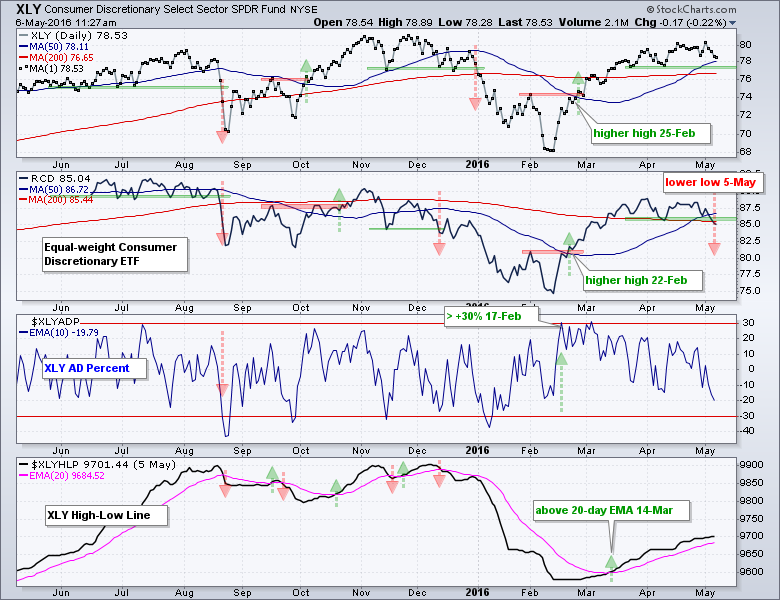
Now let's break down the market with some sector charts using the same breadth indicators. The first chart shows the Consumer Discretionary SPDR (XLY), the EW Consumer Discretionary ETF (RCD), the 10-day EMA of XLY AD Percent and the XLY High-Low Line with the 20-day EMA. The same signals apply. I am using basic support and resistance breaks on the price charts (lower lows and higher highs). AD Percent is bullish with a thrust above +30% and remains bullish until a plunge below -30%. The High-Low Line is bullish when above the 20-day EMA and bearish when below. The red and green arrows show the signals over the past year. I am looking for at least three of the four to be bullish or bearish for a strong bias. This weight of the evidence approach will result in fewer signals and, hopefully, fewer whipsaws. No system is perfect so we have to make do with imperfections and try to increase our probabilities.
As the consumer discretionary now stands, three of the four indicators are still bullish. On the bearish side, the EW Consumer Discretionary ETF broke below its April low and closed below its 200-day moving average. I do not view the 200-day as support per se. Instead, it is just a benchmark level we can use to compare with the other sectors.
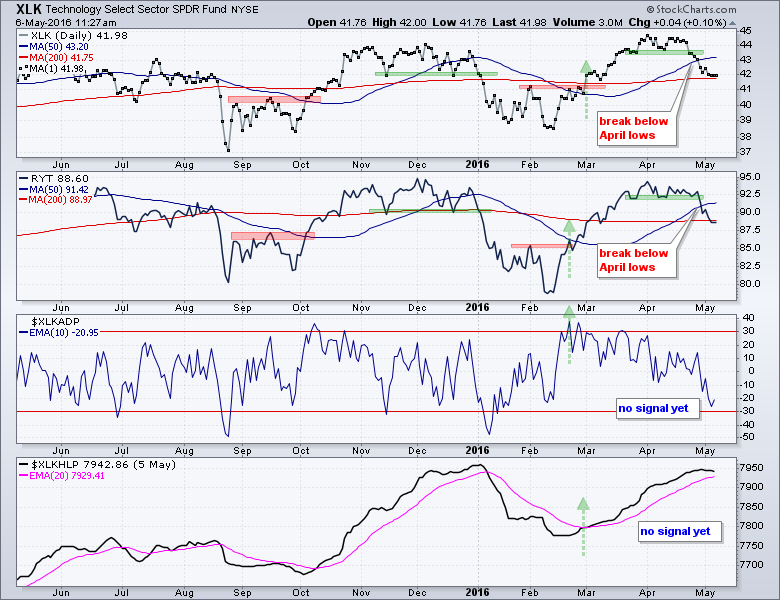
The Technology SPDR (XLK) and the EW Technology ETF (RYT) broke below their April lows and forged lower lows. RYT is below its 200-day and XLK is just above. The 10-day EMA for AD Percent has yet to negate its bullish signal from February and the High-Low Line remains above the 20-day EMA. Breadth has yet to turn bearish, but price is weak. With breadth still on a bull signal, this could be just a pullback within an uptrend so watch for a potential short-term reversal on the price charts.
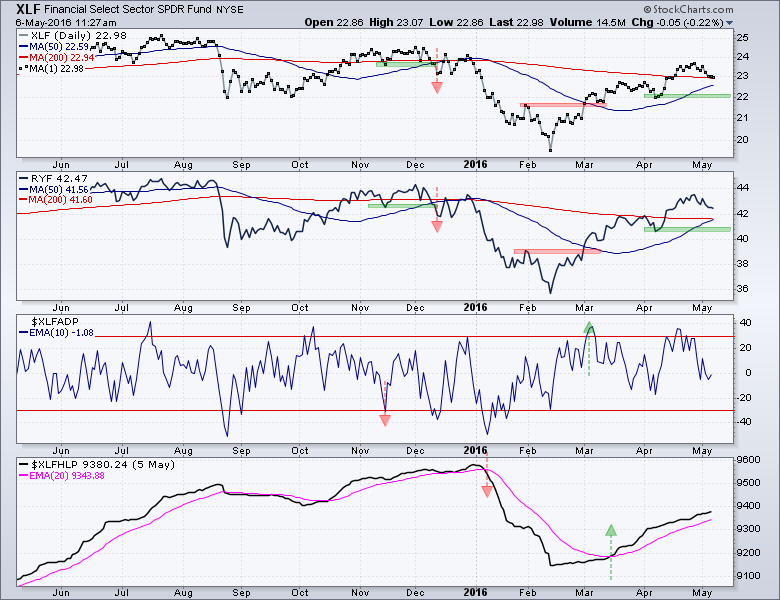
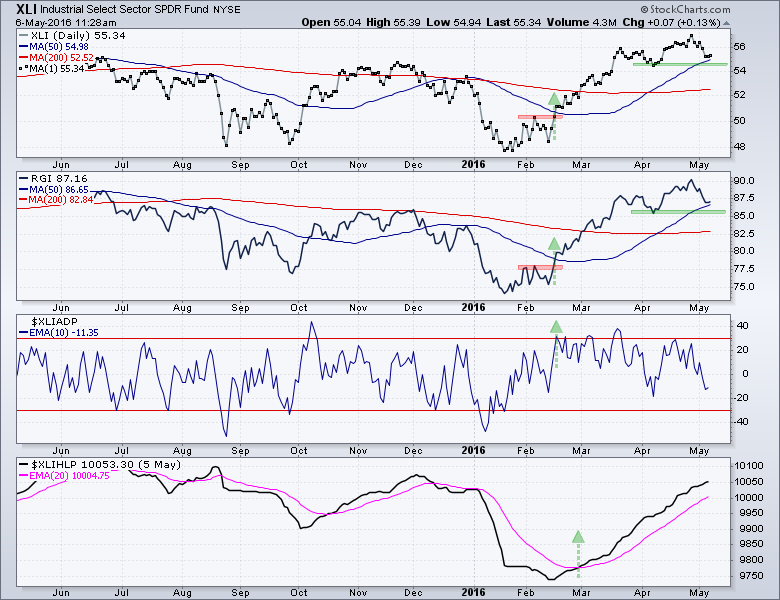
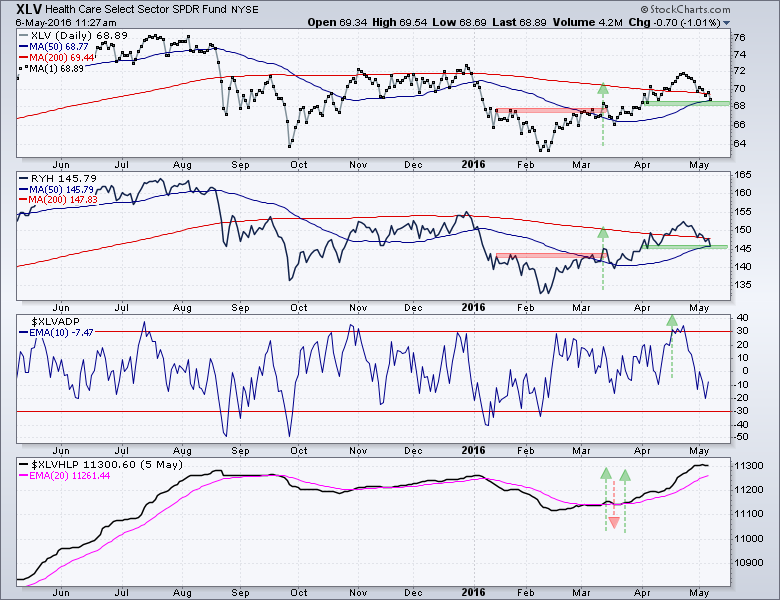
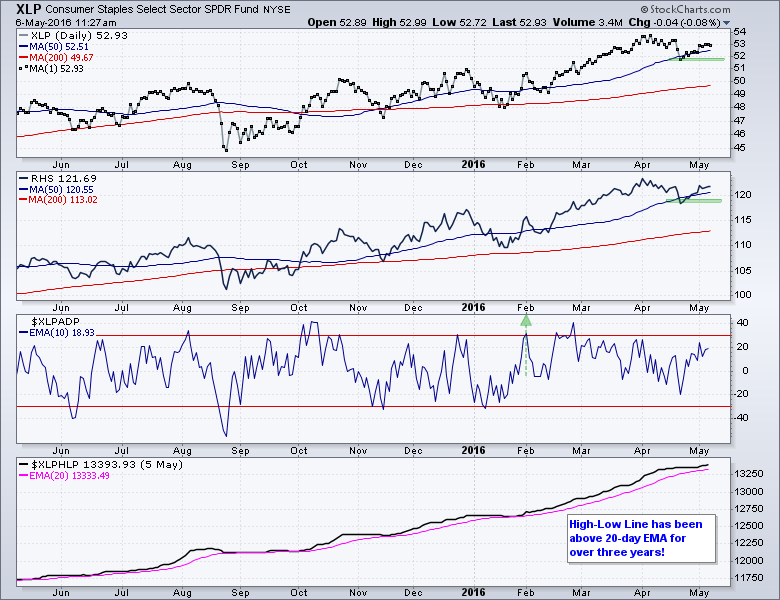
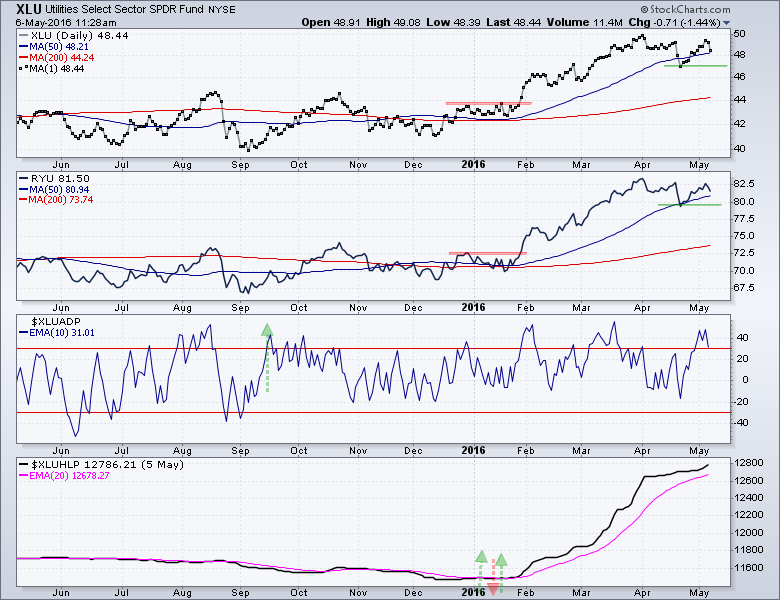
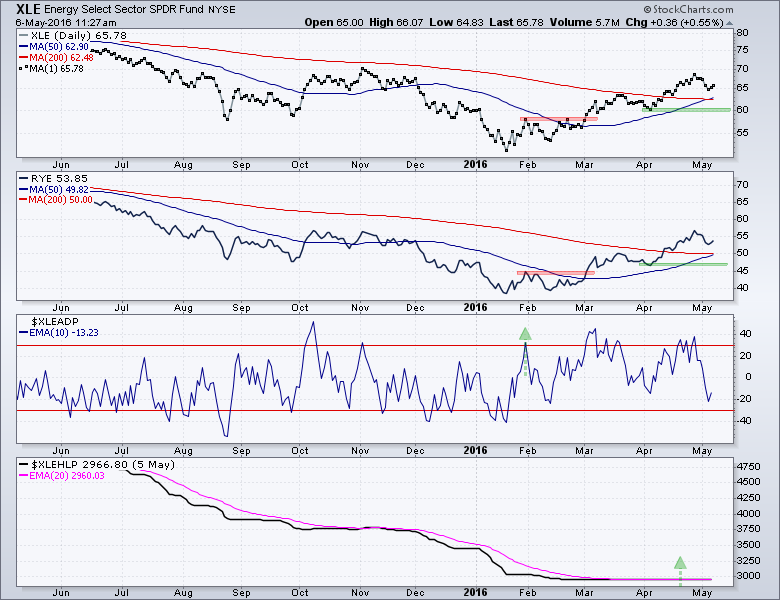
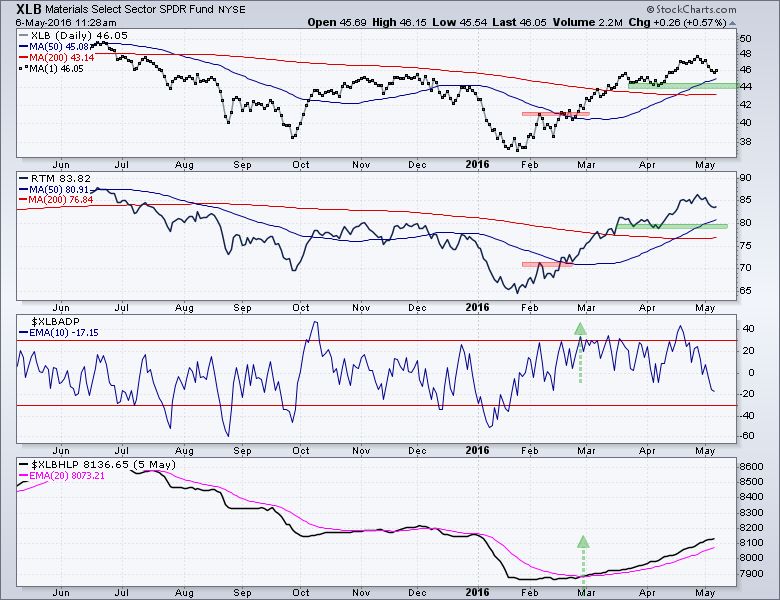
The next charts show that the price and breadth indicators are all bullish for the remaining seven sectors. I will show a sector summary and ranking table after these charts.
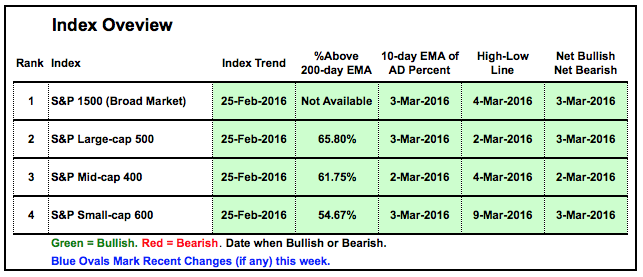
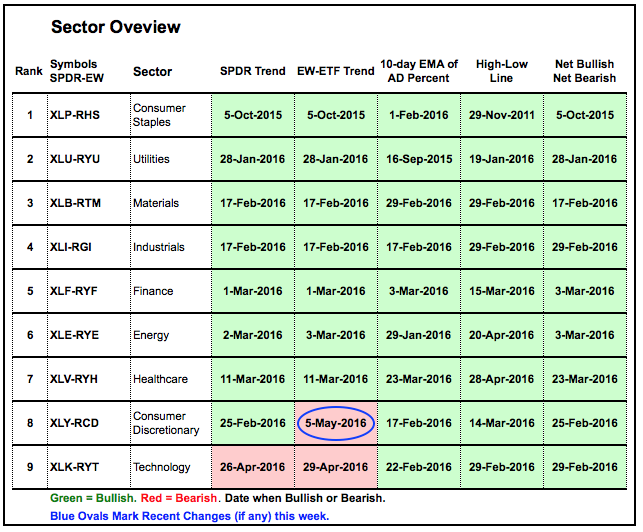
Sector Summary and Ranking Table
Even though weakness in consumer discretionary and technology is a concern, the broader market is net bullish as long as the majority of sectors remains bullish. The table below summarizes the sector signals and there are only three red boxes. I also ranked the sectors based on the date of the signals and the number of bullish-bearish signals. XLP and XLU have been bullish the longest. This table will turn from net bullish to net bearish the majority of sectors are net bearish.
Friday Food for Thought
Why Facebook Will Overtake Apple (Jon Markman)
Keep it simple stupid. That’s business adage that has stood the test of time. Facebook (FB) knows this well. Its business is so incredibly simple. It lures you inside with freebies, keeps you there with the comforts of home and other goodies, entices you to bring your friends along because hey, the more the merrier. Then it monetizes your experience. Simple.
Tesla's Wild New Forecast Changes the Trajectory of an Entire Industry (Bloomberg)
Tesla just took the most ambitious automotive production timeline since the Ford Model T and moved it up two years. The company now plans to produce 500,000 electric cars every year starting in 2018. That's 10 times the number of vehicles it produced in 2015, and enough to ensure that all 400,000 customers who put down a $1,000 deposit on the forthcoming Model 3 will qualify for a significant U.S. subsidy.
Stockbroker Economics and Overestimating Diversification (John Coumarianos)
Portfolio diversification should give an investor exposure at all times to at least one asset class (and hopefully more) that’s poised to do well. Of course, practically, that means usually having exposure to poorly performing asset classes too. But the theory, as advisors know well and explain to their clients on a daily basis, is that, with diversification, you’ll damp volatility while enjoying decent returns over the long run.
The Moving Average Research King (Wesley R. Gray)
Some weekend reading for trend-followers who want to question their beliefs. Valeriy Zakamulin is an animal when it comes to generating research on moving averages. We’ve done a lot of the same work, but we’re too lazy to tabulate the results in an academic paper format.
******************************************************
Measuring Risk On-Risk Off - Using charts to quantify stock, economic and credit risk.
PPO Trading Strategy - How to use 3 PPOs to develop a trend-reversion trading strategy.
Long-term Trend Indicators - Using the PPO, EMA Slope and CCI to determine the trend.
ETF Master ChartPack - 300+ ETFs organized in a Master ChartList and in individual groups.
Follow me on Twitter @arthurhill - Keep up with my 140 character commentaries.
****************************************
Thanks for tuning in and have a good day!
--Arthur Hill CMT
Plan your Trade and Trade your Plan
*****************************************