Consumer Discretionary Groups Underperforming // $SPX Pullback Nears first Support Zone // XLK Nears Broken Resistance and Key Retracement // Apple, Alphabet and Microsoft Firm at Support // Five Big Banks Tests their April Breakouts //// .......
I will be showing some group charts to provide analysis for the risk indicators, the broad market indexes, the nine sector SPDRs, the key stocks in QQQ and the key stocks in XLF. First, we will start out with the risk indicators for the broader market. There are eight risk indicators represented by ratio charts. For example, the SPHB:SPHQ ratio shows the performance of the S&P 500 High Beta ETF (SPHB) relative to the S&P 500 High Quality ETF (SPHQ). This ratio rises when high beta outperforms (risk on) and falls when high beta underperforms (risk off). All eight ratios fell as the stock market corrected over the last two weeks. Overall, four remain in uptrends and four are in downtrends. Of the four utprends, I am watching the April lows closely (green zones) because a break would show more risk aversion in the stock market.
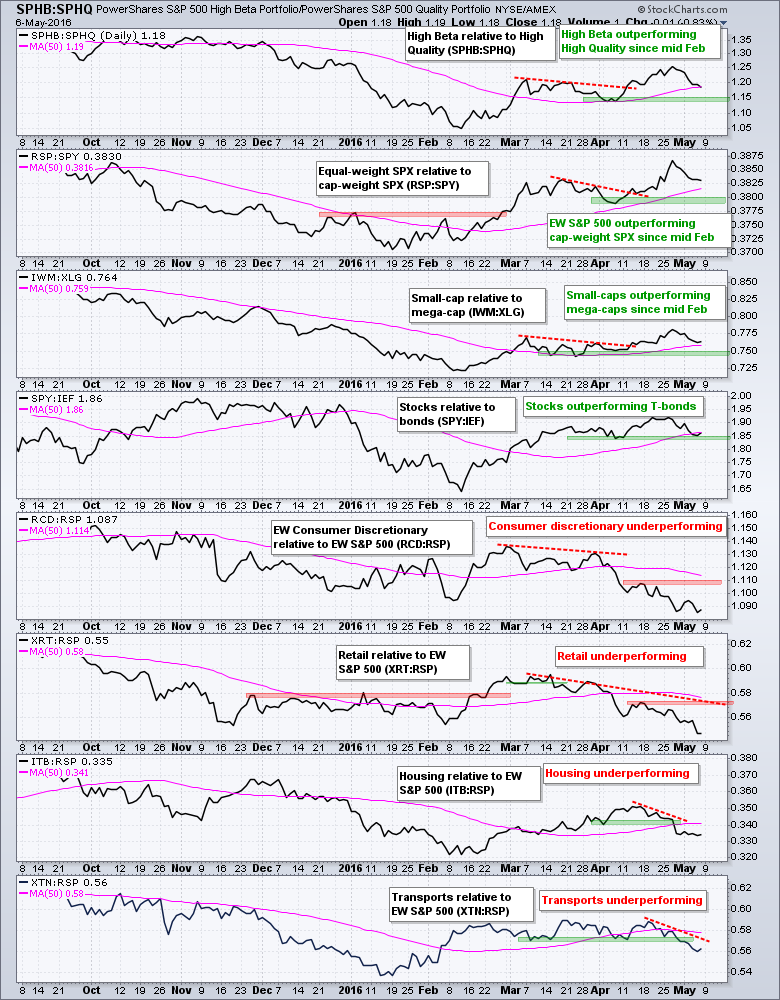
The bottom four ratios show relative weakness in four key areas of the stock market: consumer discretionary, retail, housing and transports. The technology sector is not shown, but it too is underperforming. It is negative to see these key groups lagging, but the broad market indices have seven other sectors for input. These will be covered further down.
$SPX Pullback Nears first Support Zone
The next chart shows five major stock indexes and the 50-day moving average. The S&P 500, S&P 500 Equal-Weight Index, S&P MidCap 400 and Russell 2000 are above their rising 50-day SMAs, but the Nasdaq 100 is below its 50-day SMA. I do not use these moving averages as support or resistance levels. Instead, they represent a benchmark level we can use for price comparisons. $MID and $SPXEW are the furthest above and they are showing some relative strength. The red percentage on the right shows how far the indexes fell from high to low over the last few weeks. It ain't that much.
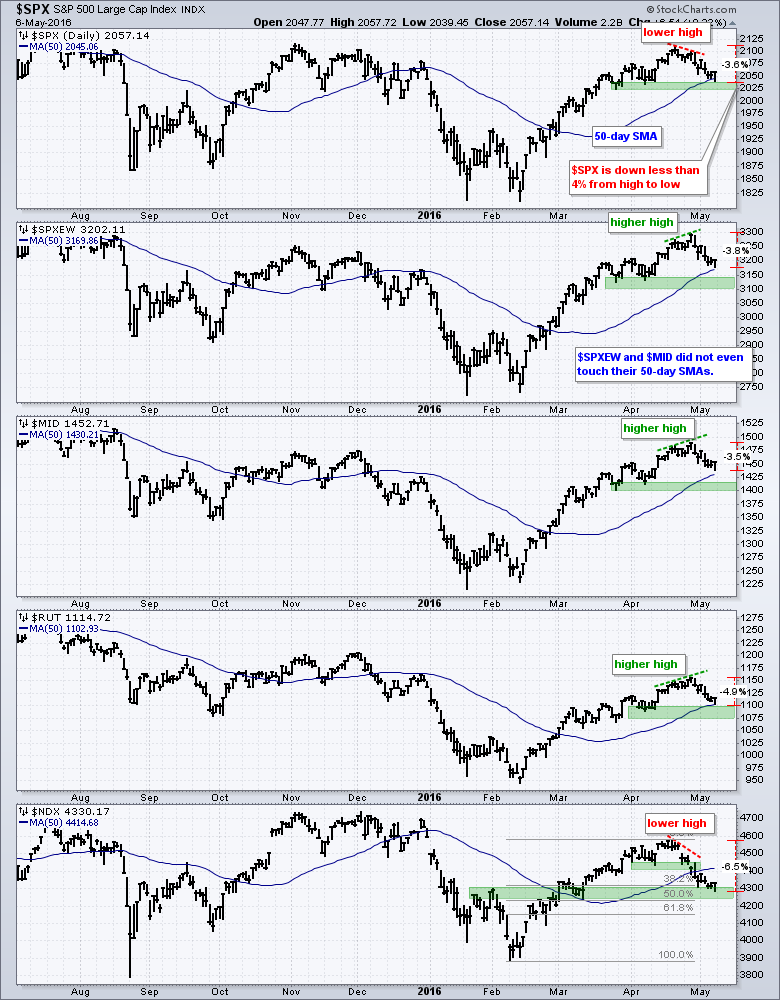
$NDX is obviously showing relative weakness because it is the only one below its 50-day. The green zones mark support based on price lows. Even though $NDX is the weakest, it is also trading in a potential reversal zone. Broken resistance turns support in the 4250-4300 area and corrections sometimes end area 38.2-50% retracement of the prior move. Note that QQQ formed a bullish engulfing on Friday and a break above 107 would reverse the short-term pullback.
XLK Nears Broken Resistance and Key Retracement
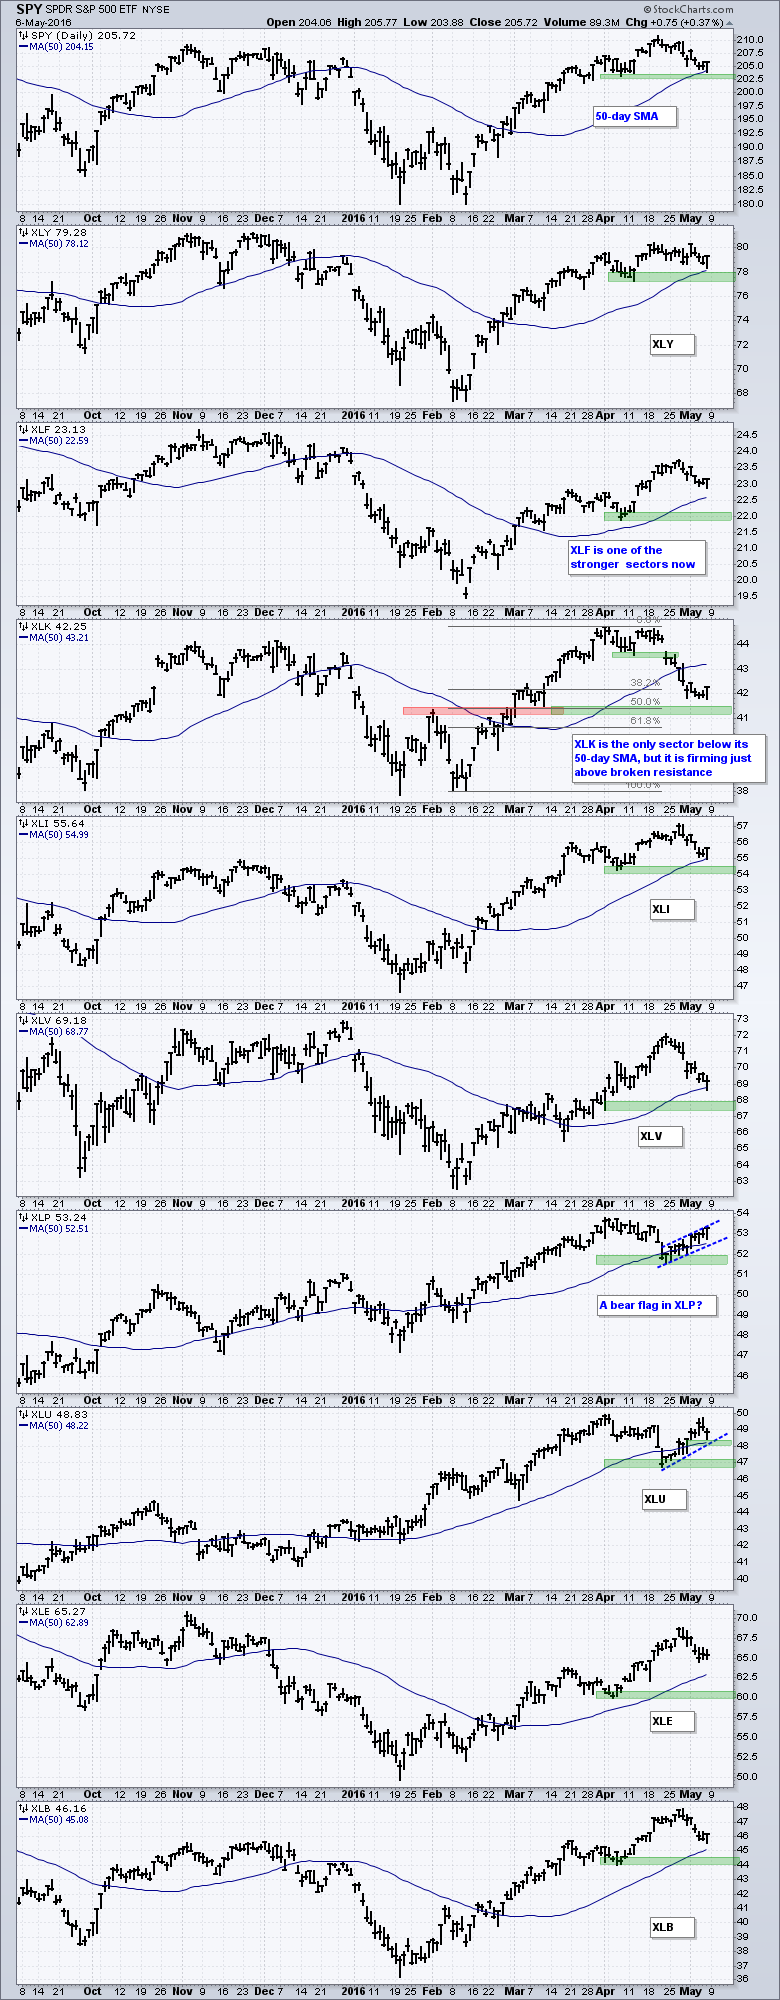
Eight of the nine sector SPDRs are above their 50-day SMAs and the 50-day SMA is rising for all nine sector SPDRs. The green support zones are based on the April lows. I think the S&P 500 is in good shape as long as the majority of sector SPDRs remain above these support zones. The trouble starts when these sector SPDRs start breaking these support zones and weighing on the broader market. Even though XLK is below its 50-day and April low, it is at an interesting juncture because it is firming just above broken resistance and trading in the 38-50% retracement zone.
Apple, Alphabet and Microsoft Firm at Support
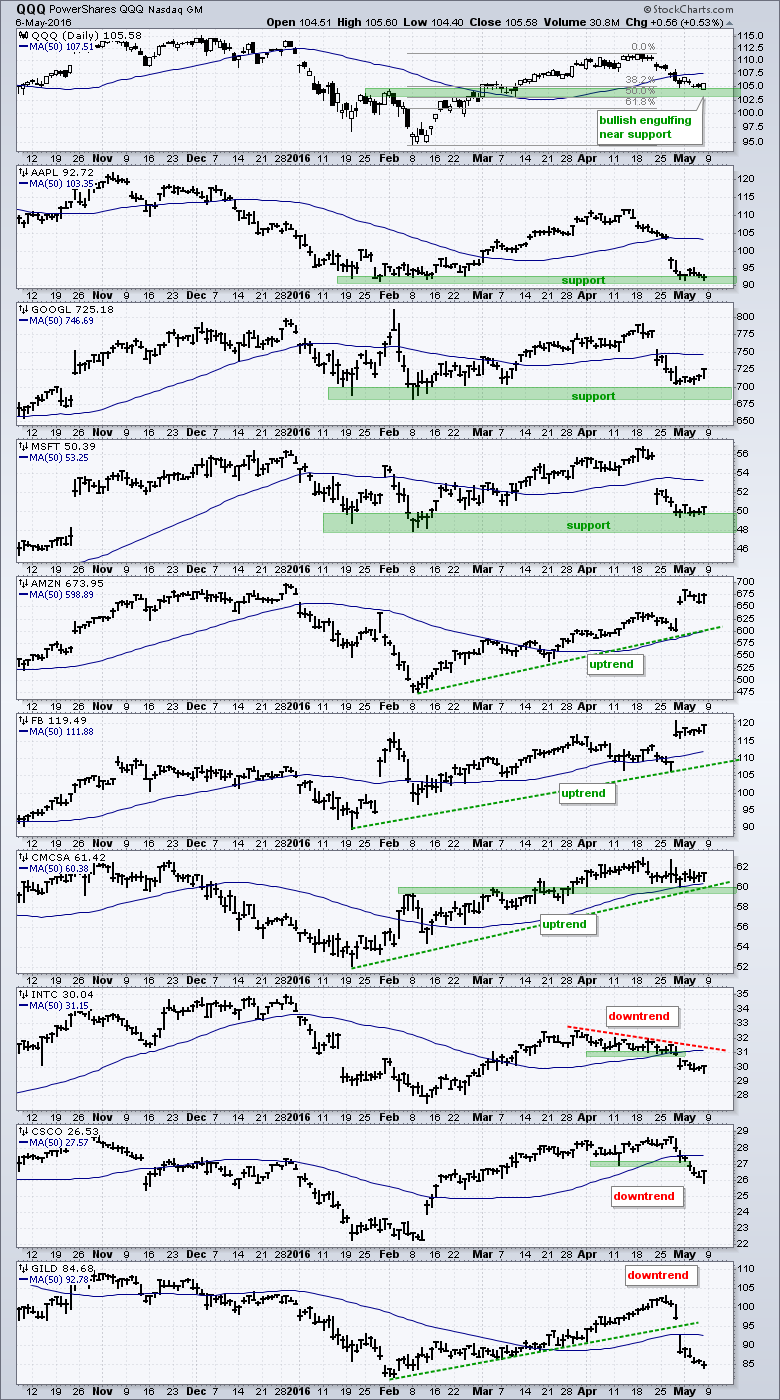
The next chart shows QQQ with the top nine stocks. Three are at support, three are in uptrends and three are in downtrends. How's that for mixed. Actually, Apple, Alphabet and Microsoft fell sharply in the second half of April with gaps and all three are below their 50-day moving averages, which are flat or pointing down. Despite weakness in April, all three firmed near support zones the last six days. With Facebook, Amazon and Comcast already in uptrends, bounces in these would be most positive for QQQ.
Key Banks Tests April Breakouts
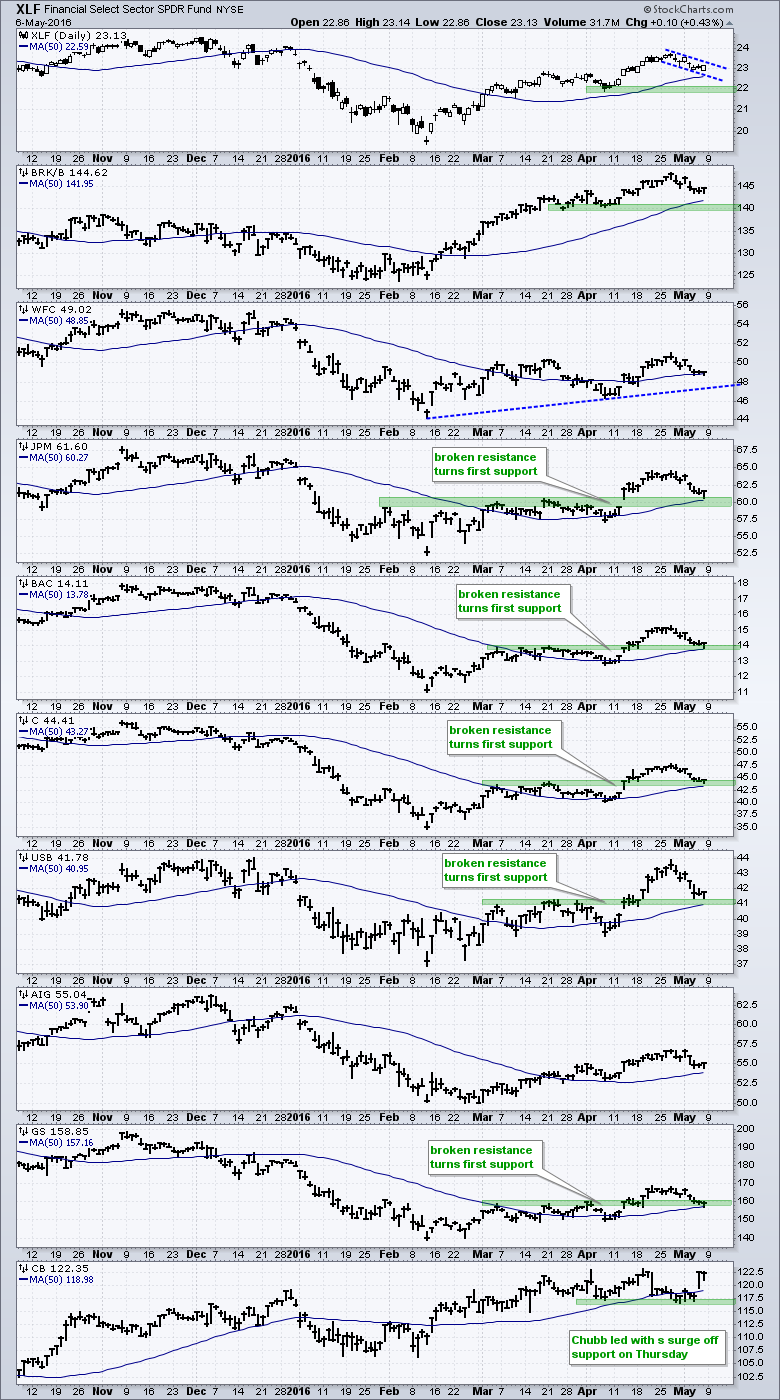
The next chart shows the Finance SPDR (XLF) with some of its top holdings. XLF is above the rising 50-day with a bull flag taking shape the last two weeks. I am also noticing some key banks at support levels that could give way to a bounce. Notice that JP Morgan, Bank of America, Citigroup, US Bank and Goldman Sachs are near support from broken resistance. All four pulled back over the last two weeks and these support zones represent the first test.
******************************************************
Measuring Risk On-Risk Off - Using charts to quantify stock, economic and credit risk.
PPO Trading Strategy - How to use 3 PPOs to develop a trend-reversion trading strategy.
Long-term Trend Indicators - Using the PPO, EMA Slope and CCI to determine the trend.
ETF Master ChartPack - 300+ ETFs organized in a Master ChartList and in individual groups.
Follow me on Twitter @arthurhill - Keep up with my 140 character commentaries.
****************************************
Thanks for tuning in and have a good day!
--Arthur Hill CMT
Plan your Trade and Trade your Plan
*****************************************


