SPY Firms within Bull Flag // Treasuries Could hold the Key for Stocks // Mind the 13-April Gaps // Banks are Holding Up Well // XRT Reverses within Zigzag Pattern // Internet ETF Grinds Higher // Webinar Preview //// .......
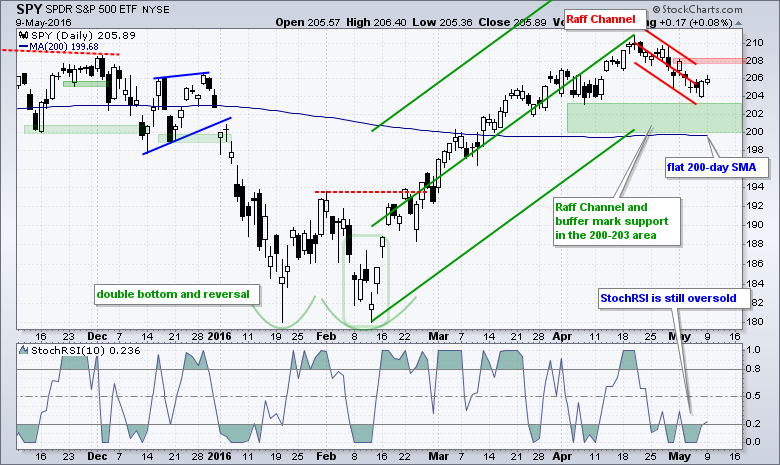
The green Raff Regression Channel defines the overall uptrend in SPY and the red Raff Regression Channel marks the falling flag of the last few weeks. SPY is trying to firm just above its green support zone in the 200-203 area. Notice that SPY closed within a 1 point range the last four days. This shows indecision that could give way to a significant move. Flag resistance is set at 208. The indicator window shows 10-day StochRSI wallowing near oversold levels. At the very least, a surge above .50 is needed to show a momentum pop. The next level to watch is .80.
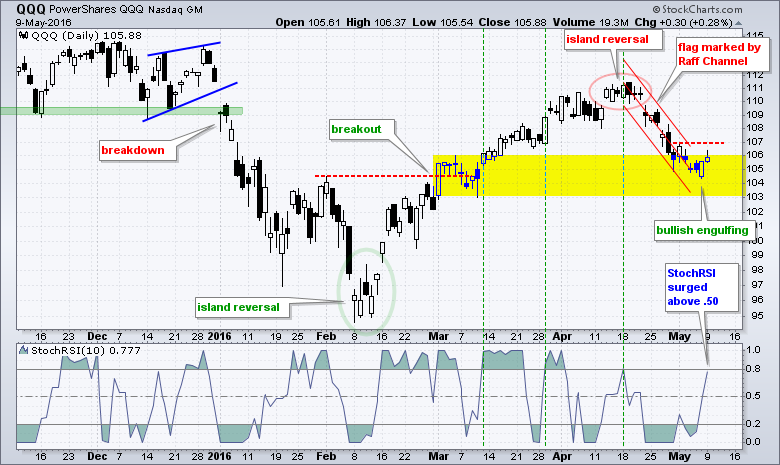
QQQ formed a bullish engulfing pattern on Friday and attempted a little follow through on Monday. This follow through fell short as the ETF closed off its high. The overall pattern and setup remain the same though. QQQ has a falling flag working and I am defining this pattern with a Raff Regression Channel. The upper line and 2-May high mark resistance at 107. A breakout here would reverse the three week downtrend and signal a continuation of the February-April advance.
Treasuries Could hold the Key for Stocks
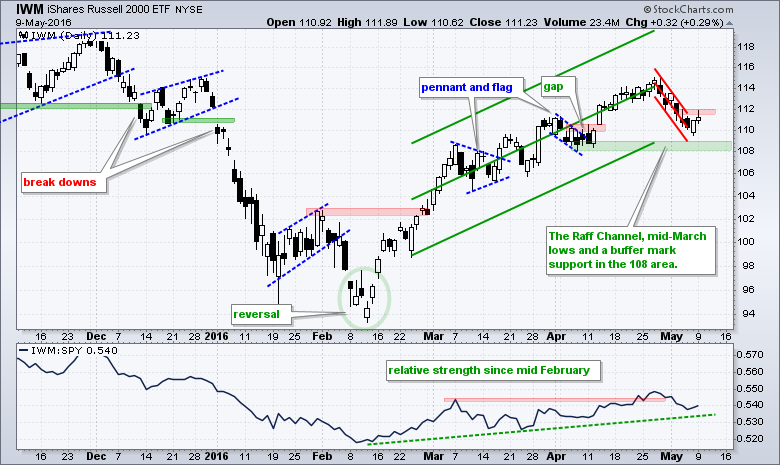
The falling flags in QQQ, SPY and IWM are potentially bullish patterns that represent small corrections within a bigger uptrend. I never know which falling flags will extend down and which will break out. For clues on that we need to check out other indicators, such as momentum, breadth or intermarket relationships. I am watching Treasuries.
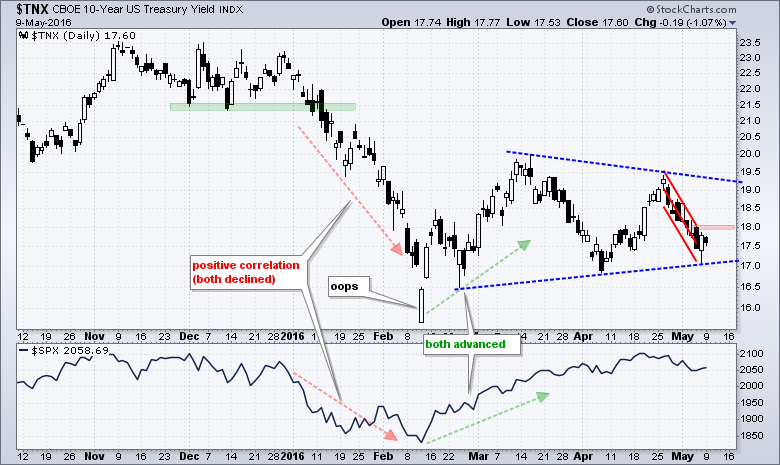
For the most part, the 10-YR Treasury Yield ($TNX) is positively correlated with the S&P 500. This means they tend to rise and fall together. Notice how they both fell in January and rose from mid February to mid March. Most recently, they both fell over the last two weeks. Overall, the 10-YR Treasury Yield fell from 23 to 16 (2.3% to 1.6%) and then consolidated with a triangle. This could be a consolidation within a downtrend and a break below 17 would be most bearish for Treasury yields (bullish for Treasury bonds). Such a move would also be negative for stocks. Short-term, I am watching the red Raff Regression Channel and resistance at 18.1 (1.81%). A breakout here would reverse the short-term downtrend in yields and this would be positive for stocks. The finance sector is especially sensitive to interest rates and a breakout in the 10-Yr T-yield would be bullish for banks.
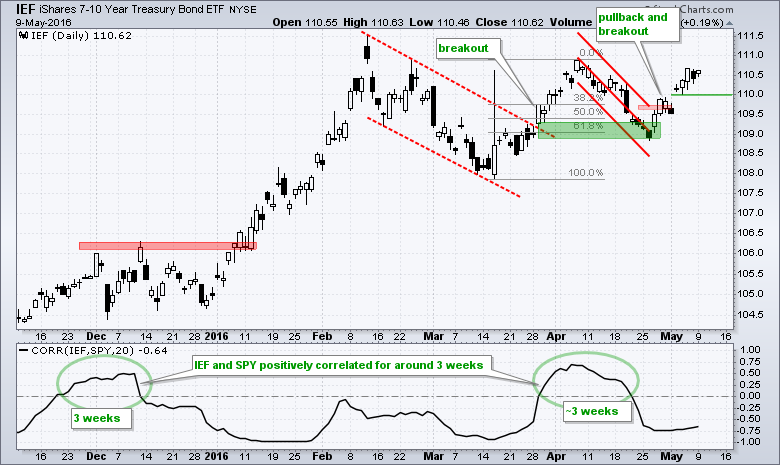
The 7-10 YR T-Bond ETF (IEF) reversed near the channel breakout and 62% retracement in late April. The subsequent breakout and two week advance correlated to weakness in stocks. Notice that IEF is negatively correlated with SPY again. Short-term support is set at 110. Watch this level for a downside break that could benefit stocks.
Mind the 13-April Gaps
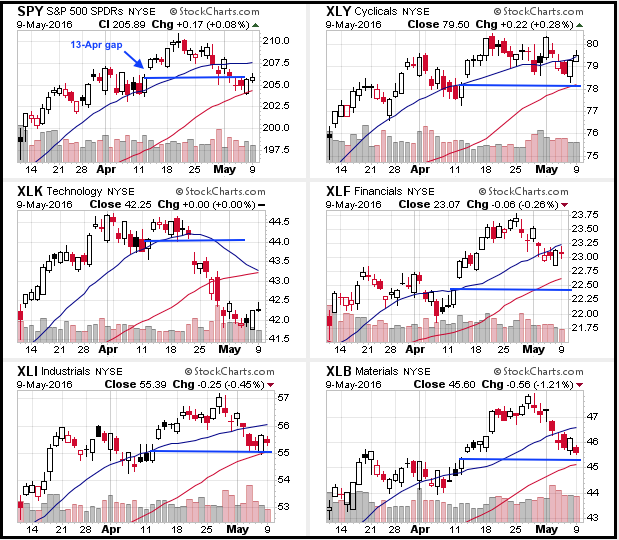
I have talked about "benchmark" levels before and I think the 13-April gap is a benchmark level. Stocks and ETFs holding these gaps show relative chart strength, while stocks and ETFs below this gap show relative chart weakness. We can even scan for this and I will do a demo in today's webinar. The CandleGlance chart below shows the 13-Apr gap for SPY and the ETF filled this gap with the pullback over the last two weeks. The blue line marks the 12-Apr close for reference. XLY, XLB and XLF did not dip below their 12-Apr close and did not fill the 13-Apr gap.
Banks are Holding Up Well
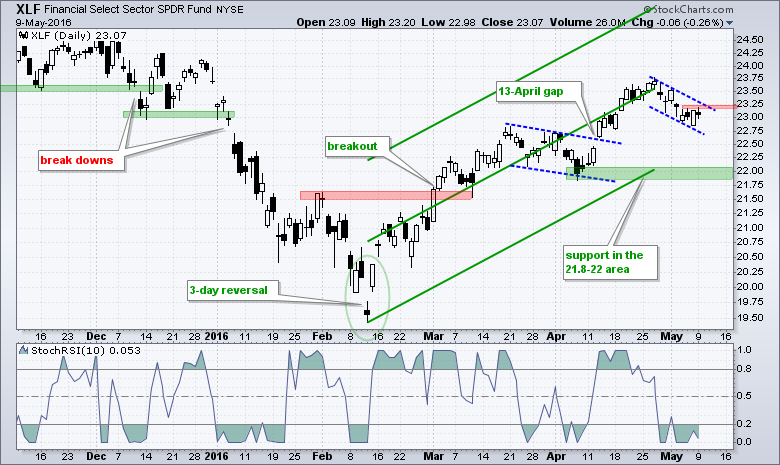
The Finance SPDR (XLF) shows relative chart strength because it held above the 13-April gap. The ETF corrected over the last two weeks with a falling flag and stalled with four closes around 23 the last four days. A flag breakout would be short-term bullish, especially if accompanied by a breakout in the 10-yr T-yield.
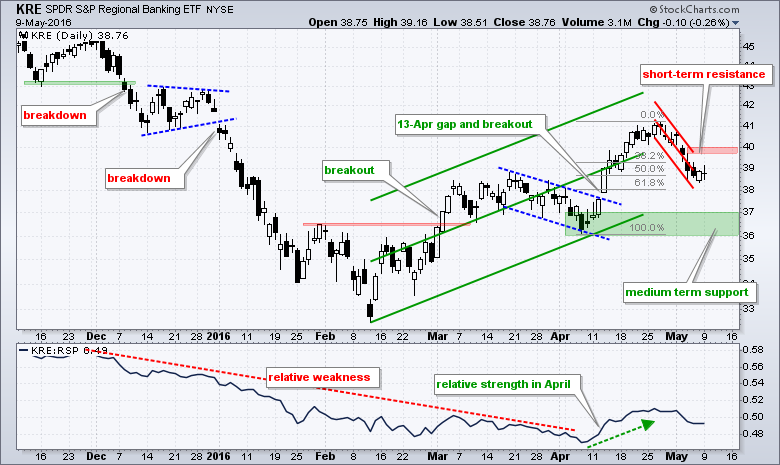
The Regional Bank SPDR (KRE) is at a most interesting juncture because it stalled in the 50-62% retracement zone. First, notice that the trend since mid February is up (green Raff Regression Channel). Second, notice that the short-term trend us down (red Raff Regression Channel). This means the short-term downtrend is viewed as a correction within a bigger uptrend. This bigger uptrend is the dominant force and I am looking for a short-term breakout to signal a continuation of the bigger uptrend. Notice that KRE is firming in the 50-62% retracement zone with a falling flag of sorts. It is not picture perfect, but the essence of the pattern is there. A breakout at 40 would reverse the fall of the flag.
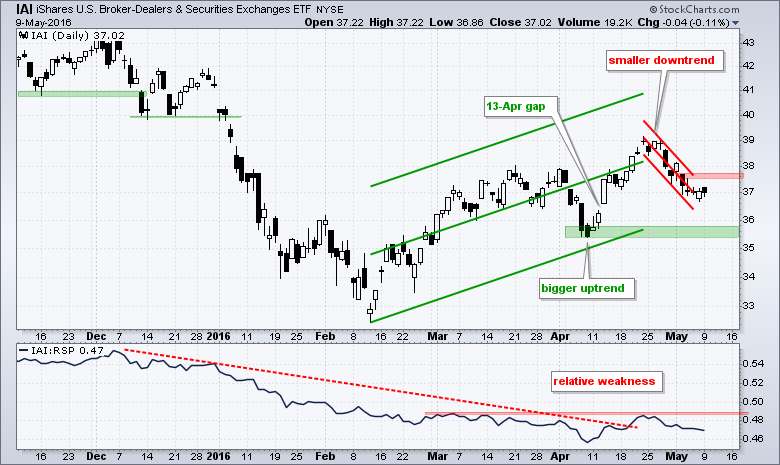
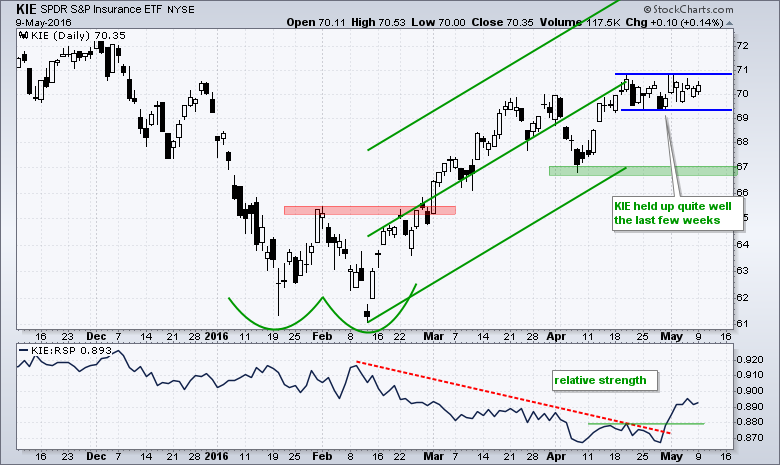
The Broker-Dealer iShares (IAI) and Insurance SPDR (KIE) charts are also shown for reference. Note that KIE held up quite well the last few weeks and the price relative broke out in late April.
XRT Reverses within Zigzag Pattern
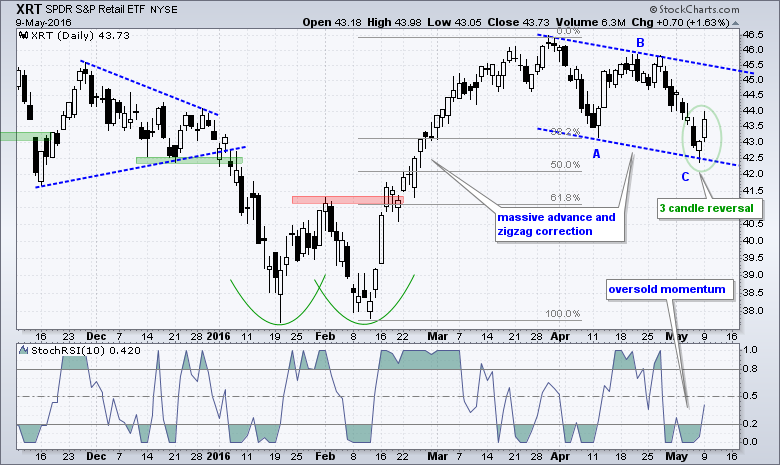
I highlighted relative weakness in retail stocks last week so the Retail SPDR (XRT) promptly found some support and forged a three candlestick reversal (note the sarcasm). Before looking at the chart, note that I am bullish on stocks overall and this means I expect more bullish resolutions than bearish resolutions on the charts. Also note that XRT surged over 20% earlier this year and the ETF was entitled to a corrective period. The decline since early April retraced 38-50% with an ABC type zigzag, which comes from Elliott Wave theory. I don't use much Elliott, but the ABC zigzag correction was one of my takeaways from the Frost-Prechter book. I am highlighting this pattern now because XRT formed a 3-candlestick reversal that is similar to a morning star. There are no gaps on either side of the middle candlestick, but it is a hammer-type candlestick. This is the first sign of a short-term reversal and perhaps a challenge to bigger resistance in the mid 40s.
Internet ETF Grinds Higher
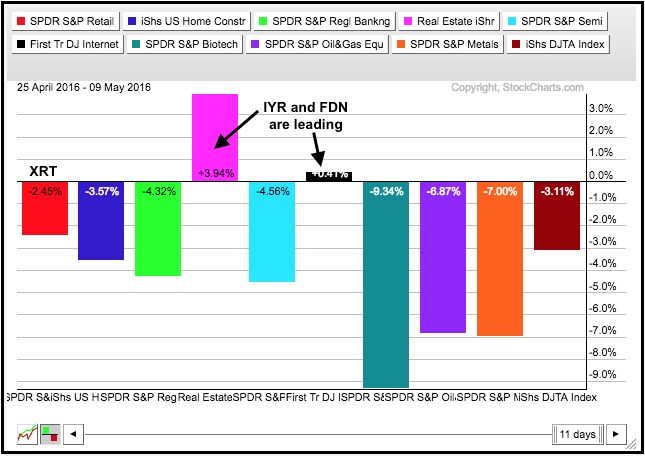
I highlighted the Internet ETF (FDN) in the webinar last Tuesday and continue to watch this one as it grinds higher. QQQ is down around 3% the last two weeks, but the Internet ETF (FDN) is actually up a fraction over this same timeframe. The PerfChart below shows the percentage change for ten industry group ETFs over the last two weeks. The REIT iShares (pink) is the clear leader and FDN (black) is slightly positive. The Retail SPDR (red) has the smallest loss of the eight losers.
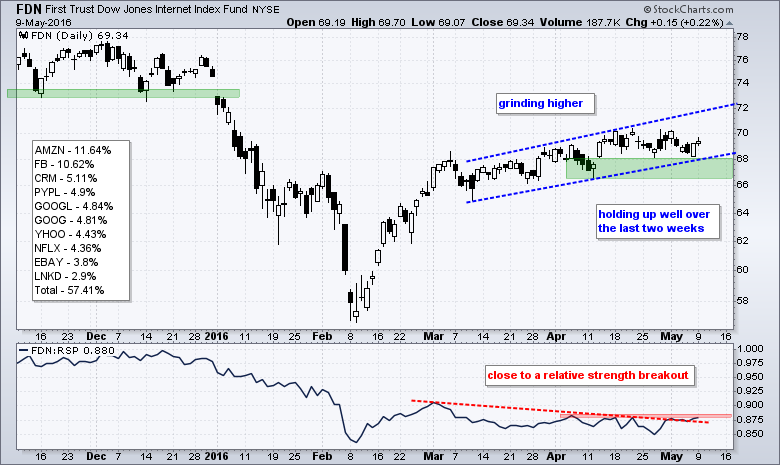
On the price chart, FDN is grinding higher within a relatively tight rising channel. The lower trend line and late April low mark first support at 68. The April low marks second support just above 66. Taken together, there is a support zone in this area. In the indicator window, the price relative turned up in late April and is challenging the April high. A breakout would show a return to relative strength. The top ten holdings are listed on the left of the chart and I featured charts for AMZN, FB and GOOGL on Monday and last Thursday.
Webinar Preview
I will discuss these charts and more in today's webinar (Tuesday, May 10th, at 1PM ET).
- Scanning for the 13-April gap
- Sector SPDR Chart Analysis
- Key Industry Group ETFs
- Oil, Gold and Dollar (coffee too)
******************************************************
Measuring Risk On-Risk Off - Using charts to quantify stock, economic and credit risk.
PPO Trading Strategy - How to use 3 PPOs to develop a trend-reversion trading strategy.
Long-term Trend Indicators - Using the PPO, EMA Slope and CCI to determine the trend.
ETF Master ChartPack - 300+ ETFs organized in a Master ChartList and in individual groups.
Follow me on Twitter @arthurhill - Keep up with my 140 character commentaries.
****************************************
Thanks for tuning in and have a good day!
--Arthur Hill CMT
Plan your Trade and Trade your Plan
*****************************************


