SystemTrader - Tweaking the Golden Cross // Testing Other Indexes // Testing the Golden Cross with Short Positions // Testing with Exponential Moving Averages // The Pitfalls of Optimization // Optimizing the Long-term Moving Average Cross // The Russell 2000 is a Different Beast // Final Thoughts //// ........
Last week I tested a trading system using the golden cross for the S&P 500 since 1960. This simple strategy goes long when the 50-day SMA crosses above the 200-day SMA and out when the 50-day crosses below the 200-day, which is a death cross. The Compound Annual Return (CAR) beat buy-and-hold just barely (6.62% vs 6.50%), but the Risk-adjusted Annual Return (RAR) was much higher (9.70% vs 6.50%). The Risk-adjusted Return was higher because the system was exposed to the market 68% of the time. Buy-and-hold, of course, was exposed 100% of the time.
Testing Other Indexes
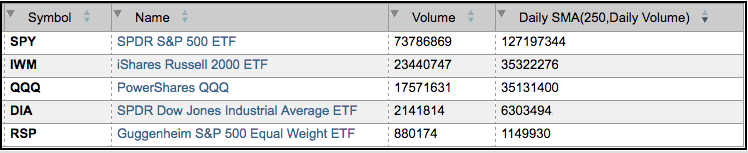
This week I will expand this test by looking at the S&P 500, S&P 500 Equal-Weight Index, Dow Industrials, Nasdaq 100 and Russell 2000. I will test the golden cross with a long only strategy and a long-short strategy. I will then compare the simple moving average with the exponential moving average, and then optimize to see if we can improve the moving average settings without too much curve fitting. Note that this testing was done using Amibroker software. I chose these five indexes because they are well known, complementary and have liquid ETF equivalents.
First and foremost, note that the golden cross strategy is a long-term trend following system that seeks to capture an existing trend and profit as that trend extends. No trend = no profit. Even though timeframes are not uniform, I consider this a long-term system because both moving averages are fairly long.
Testing Other Indexes
The table below shows backtesting results using the golden cross as the trading strategy and taking only long positions (from 1/1/1990 to 5/31/2016). Bear with me and don't glaze over because it is a table of numbers. There are two key takeaways here and they are highlighted with the red and green ovals. First, the top row shows the positive highlights for the S&P 500 in green. The Compound Annual Return was 7.42% and this beat buy-and-hold, which returned 6.90% per annum. Also notice that there were 10 winners and 3 losers. These numbers suggest a slight edge when using the golden cross for the S&P 500. Perhaps it is because so many people follow these two moving averages and the S&P 500 is the most widely used benchmark. It kind of becomes a self-fulfilling prophecy.
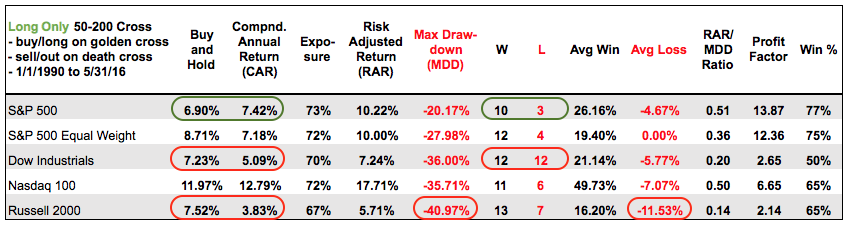
The red ovals show the negative highlights for the Dow Industrials and Russell 2000. The Compound Annual Return did not beat buy-and-hold for either index. The Dow Industrials returned 5.09% per annum and the Russell 2000 returned less than 4% (boo hiss!). There were 12 losing trades and 12 winning trades (50/50) for the Dow. The Russell 2000 faired better with the win/loss ratio, but the Maximum Drawdown was a whopping 41% and the average loss on losing trades was double digits.
Bottom Line: The golden cross has not been NOT a good long-term system for the Dow Industrials and Russell 2000. Chartists would be better off using another moving average pair for signals. The chart below shows the Russell 2000 with signals from 1993 until 2003.
Testing the Golden Cross with Short Positions
Maybe the golden cross will perform better if we add short positions on the death cross. After all, traders can use inverse ETFs to profit from the downside. The table below shows a long-short system using the golden cross to exit shorts and enter longs, and the death cross to enter shorts and exit longs. The red ovals highlight the drawbacks of this long-short system.
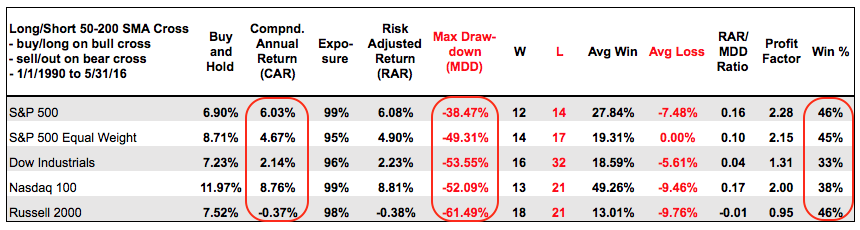
First, the Compound Annual Return is lower than the annual return for buy-and-hold. In other words, we would have been better off using a buy-and-hold strategy than a long-short strategy. Second, the Maximum Drawdown increased and surpassed the 50% threshold for the S&P 500 Equal-Weight Index, the Dow Industrials, the Nasdaq 100 and the Russell 2000. It would not be fun to sit through a 50% drawdown in a portfolio. Third, the winning percentage drops below 50%.
Bottom line: It does not pay to short the market using a long-term trend following system. Thus, the next tests will focus on long-only systems and ignore the short side of the market for now.
Testing with Exponential Moving Averages
What about using the golden cross with exponential moving averages instead of simple moving averages? The results are not very different, but the Compound Annual Return for the Russell 2000 improved a bit. The Russell 2000 returned 3.83% per annum with the simple moving averages and 5.96% per annum with the exponential moving averages. Even so, this return still underperformed buy-and-hold. The Nasdaq 100 also performed a little better with the exponential moving averages. On the downside, the winning percentage for all five indexes dropped when using the 50-day EMA and 200-day EMA. The Nasdaq 100 and S&P 500 were the only two indexes with a winning percentage greater than 51%.

Bottom Line: The jury is still out when it comes to the great moving average debate (EMAs vs SMAs).
The Pitfalls of Optimization
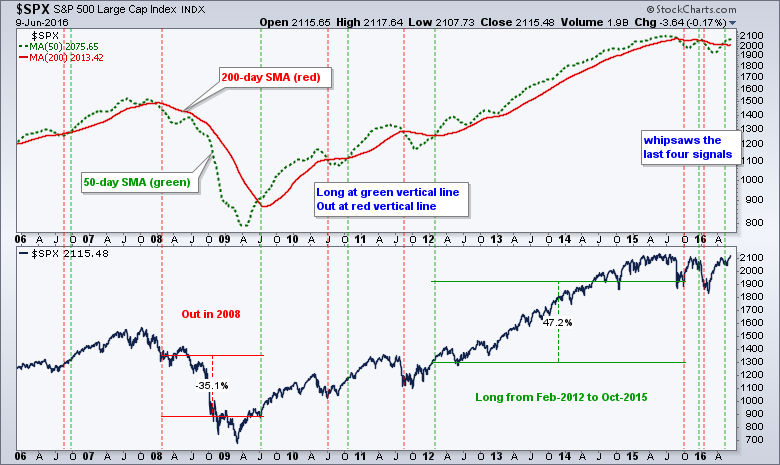
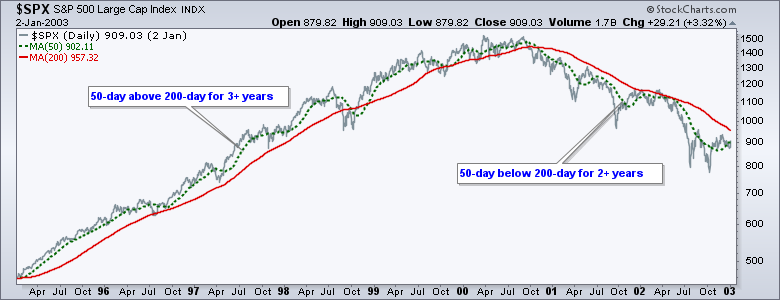
Before we get into optimization, note that optimizing is a slippery slope and there is no such thing as the perfect moving average pair. What worked in the past is not guaranteed to work in the future. Moreover, there are different types of market environments. The chart below shows the S&P 500 trending higher from 1995 until 2000, and then trending lower from 2001 until 2002. A 50-200 moving average crossover system would have worked great because of the strong trends.
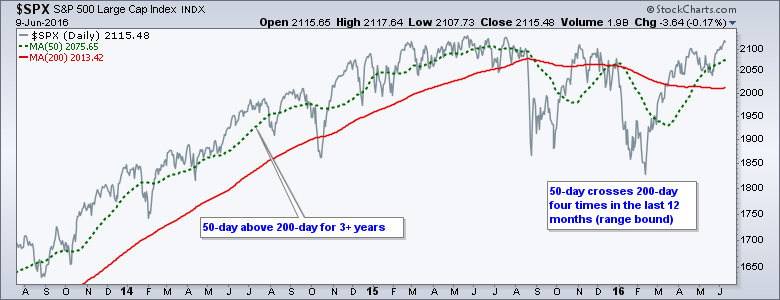
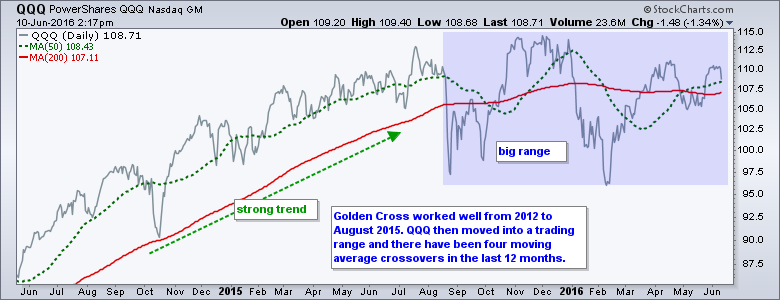
The environment was different in 2010, 2011 and over the past year. After a long uptrend from 2012 to 2015, the 50-day crossed the 200-day four times over the last 12 months. Can you spell W-H-I-P-S-A-W? The market moved from trending to trading range and this produced whipsaws using the golden cross trading system. Clearly, a different moving average pair would have worked better over the last 12 months.
Tweaking the Long-term Moving Average Cross
I ran a test to optimize the moving average pairs for the S&P 500. The fast moving average optimization ranged from 5 to 60 days and the slow moving average ranged from 60 to 300 days. This ensured that we would have a short-term moving average of 60 days or less and a long-term moving average between 60 and 300 days.
I am not looking for the single best pair. Instead, I am looking to see if any patterns emerge or if any moving average lengths appear more often than others. The table below is sorted by Compound Annual Return (CAR). I threw out the top five results so this table shows the top twenty after the first five (numbers 6 through 25). The OptFast column shows the optimization for the fast moving average and the OptSlow column shows the optimization for the slow moving average.
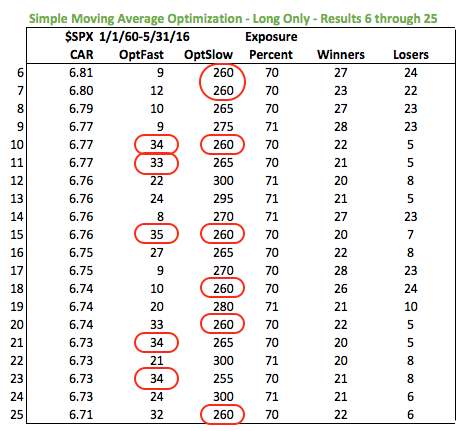
Two things jump out. First, the optimization for the faster moving average (OptFast) is less than 50 days and there seem to be quite a few numbers in the low-mid thirties. Second, the optimization for the slower moving average (OptSlow) is more than 250 days and 260 seems to pop up quite often. Thus, it seems that we would be better off shortening the fast moving average and lengthening the slow moving average. Perhaps, a 35-day SMA and a 260-day SMA.
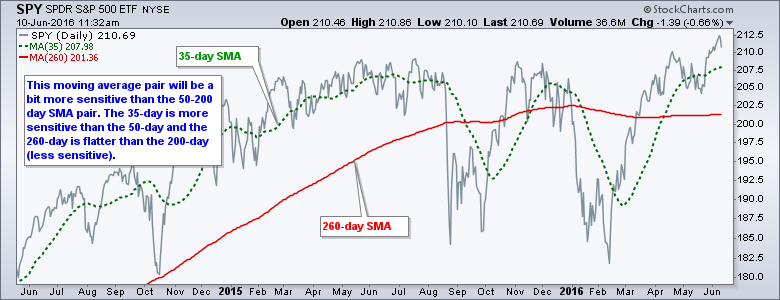
The chart above shows SPY with the 35-day SMA in green and 260-day SMA in red. This pair does not eliminate whipsaws because these are unavoidable with any moving average pair. And, I will be the first to admit that the classic golden cross will probably perform just as well, especially for the S&P 500. Note that a backtest for this pair barely beat the backtest for the golden cross.
The Russell 2000 is a Different Beast
In contrast to the S&P 500, the optimizations for the Russell 2000 show just how ill-suited this index is for the golden cross. The optimized slow moving averages are all below 14 and the optimized slow moving average ranges from 60 to 105. There seems to be some clustering in the 12-14 area and the 70 to 80 area.
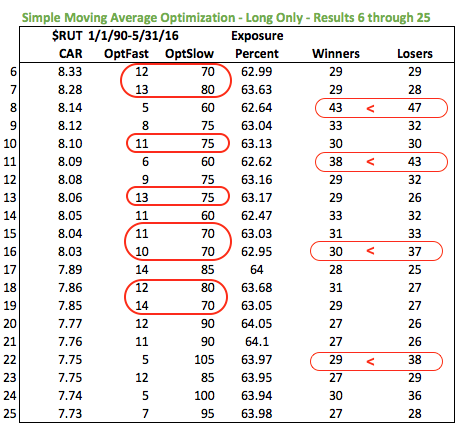
This shows that the Russell 2000 is better suited for a faster moving average pair that will generate more signals. A faster pair, however, means more signals and more losing signals. Notice that losing trades out number winning trades on many of the moving average pairs. This means the system needs to make more on winning trades than losing trades to turn a profit.
Bottom Line: Chartists should experiment with shorter moving averages for the Russell 2000 and be prepared for more signals. Cesar Alvarez confirmed that trading strategies for large-caps often do not work on small-caps.
Final Thoughts
The optimizations are not really for finding the BEST moving average pair. Instead, the optimization helps us understand the character of the underlying index. The S&P 500 and Nasdaq 100 performed well with the golden cross, but the Russell 2000 and the Dow Industrials did not. The Nasdaq 100 was by far the best performing of the five indexes and the only one with double-digit gains using the golden cross. This indicates that the Nasdaq 100 is capable of some very strong trends and it pays to get involved in these trends. The Russell 2000 was the big outlier for this group and this means chartists should use different settings for small-caps.
 *************************
These trading strategies were tested using Amibroker. Cesar Alvarez of AlvarezQuantTrading.com helped with the coding and provided consulting. Cesar was head of Research at Connors Research and wrote High Probability ETF Trading as well as Short-term Trading Strategies that Work. For more information about his testing and consulting services, click here.
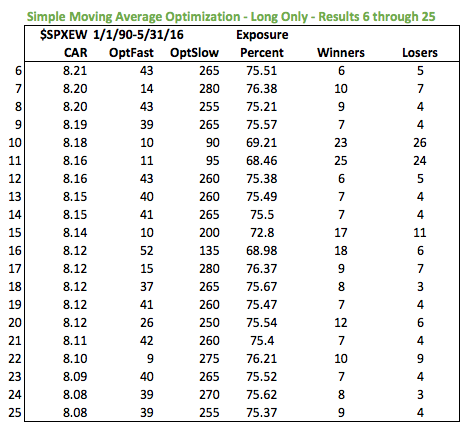
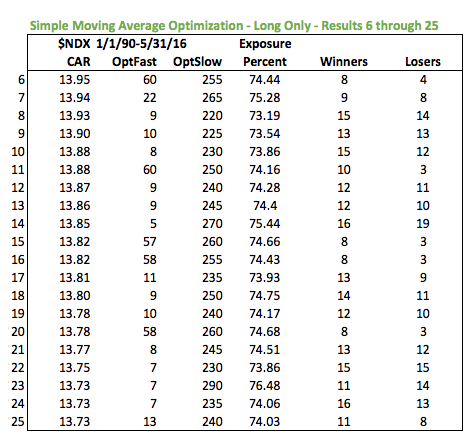
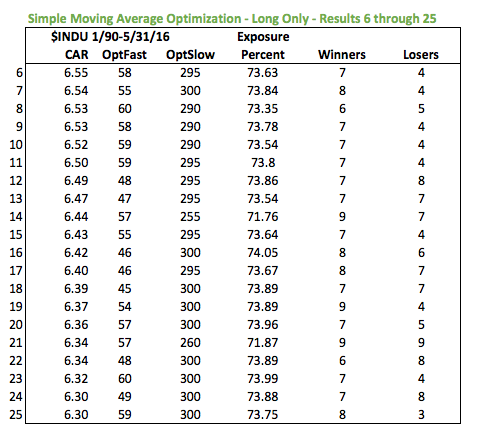
For reference, the next three tables show the numbers for the Nasdaq 100, S&P 500 EW Index and Dow. The first five results to omitted to eliminate any outliers and these tables show results 5 through 25. All three indexes seem to test better with longer slow moving averages (> 220 days). The results were more mixed with fast moving average, but there is some clustering in the 40-60 area. In short, the results seem in line with the S&P 500. The Russell 2000 is the only outlier.
******************************************************
Measuring Risk On-Risk Off - Using charts to quantify stock, economic and credit risk.
PPO Trading Strategy - How to use 3 PPOs to develop a trend-reversion trading strategy.
Long-term Trend Indicators - Using the PPO, EMA Slope and CCI to determine the trend.
ETF Master ChartPack - 300+ ETFs organized in a Master ChartList and in individual groups.
Follow me on Twitter @arthurhill - Keep up with my 140 character commentaries.
****************************************
Thanks for tuning in and have a good day!
--Arthur Hill CMT
Plan your Trade and Trade your Plan
*****************************************


