Flag Breakout Fails for S&P 500 // AD Percent Remains on a Bull Signal // New Lows have yet to Expand // %Above 200-day Near Bearish Signal for Nasdaq 100 // Consumer Discretionary Remains the Weakest Sector // Finance Sector Weakens Considerably //// .....
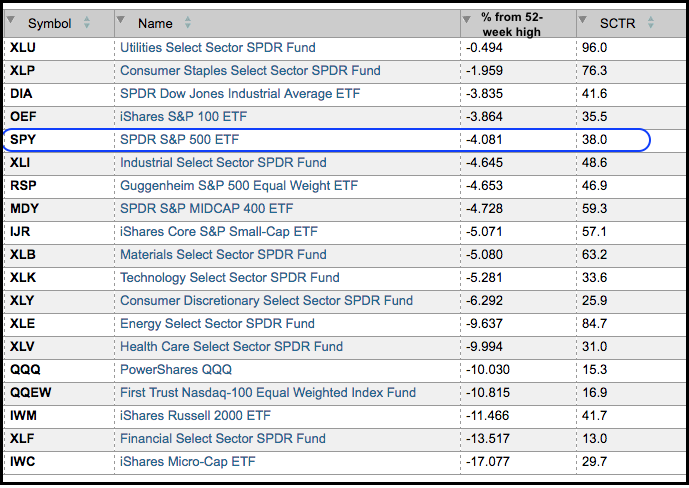
Friday's sharp decline is just a blip on the monthly charts, but we still have four trading days remaining so I will wait until the month is finished before looking at this timeframe. On a weekly basis, the S&P 500 fell 1.63% last week and is now down three weeks in a row. Even so, the index is much closer to a 52-week high than a 52-week low and we have yet to see an important support break. The table below shows SPY around 4% from its 52-week high. Today I will look at two charts to mark key support and review the breadth indicators for the broad market and the sectors.
The late May flag breakout clearly failed and the S&P 500 is setting up for a support test on the mid May lows. The 200-day day moving average is around 2020 and the 52-week moving average is around 2025. As noted in Friday's commentary, I am more inclined to mark a support zone in the 2000-2030 area and turn bearish on a weekly close below 2000.
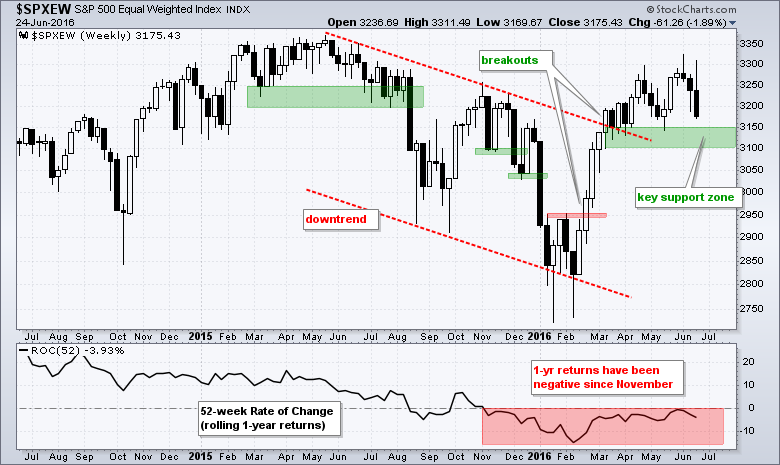
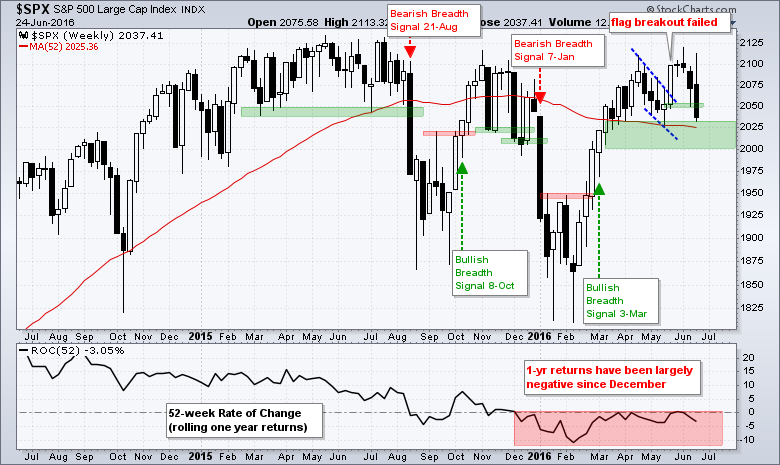 Looking back over the past year, we can see four big price swings that were greater than 10%. Each swing triggered a breadth signal, two bearish and two bullish. The last breadth signal was bullish on March 3rd and I will review the breadth charts a little further down. Lastly, notice that the 52-week Rate-of-Change has been largely negative since December. This means investors holding stocks for a year have experienced negative annual returns the last seven months and they are not very happy. The next chart shows the S&P 500 Equal-Weight Index ($SPXEW) with key support in the 3100-3150 area. Thus, weekly closes below 2000 in $SPX and 3100 in $SPXEW would clearly reverse the uptrend.
AD Percent has yet to Trigger Bearish
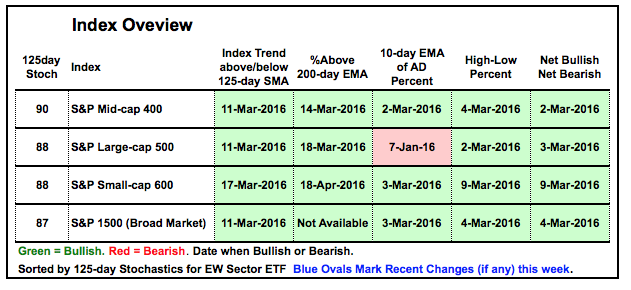
Over the years, I have put together a rather basic timing model for the broader stock market. It includes some basic trend analysis for the S&P 500, S&P Small-Cap 600 and S&P MidCap 400 as well as three breadth indicators: AD Percent, High-Low Percent and the Percentage of Stocks above the 200-day SMA. Even though this model is not perfect, an approach using well-defined signals is more objective than subjective. Objectivity is important because it removes emotions, interpretations and biases from our investing decisions.
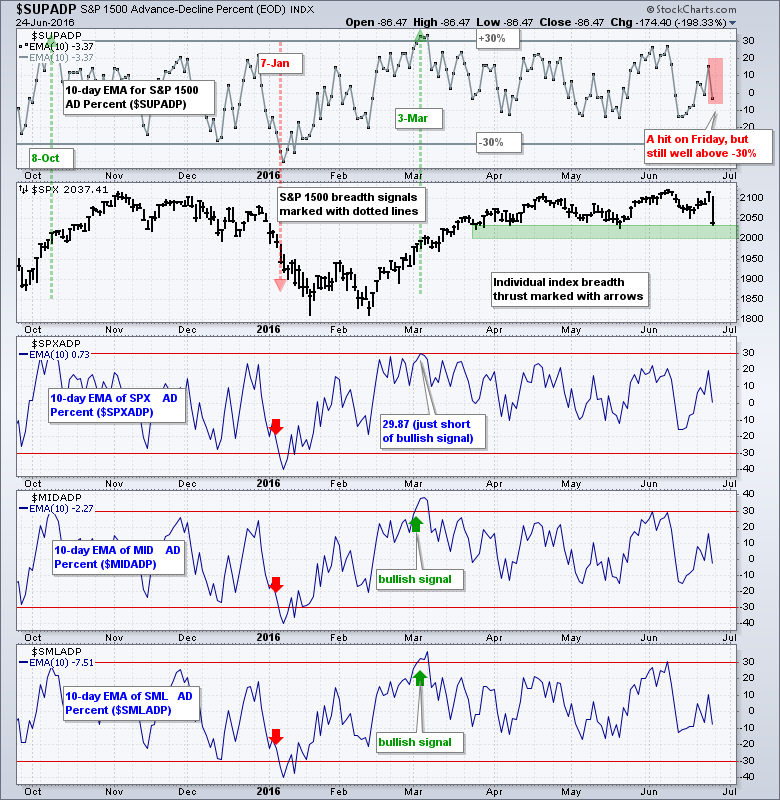
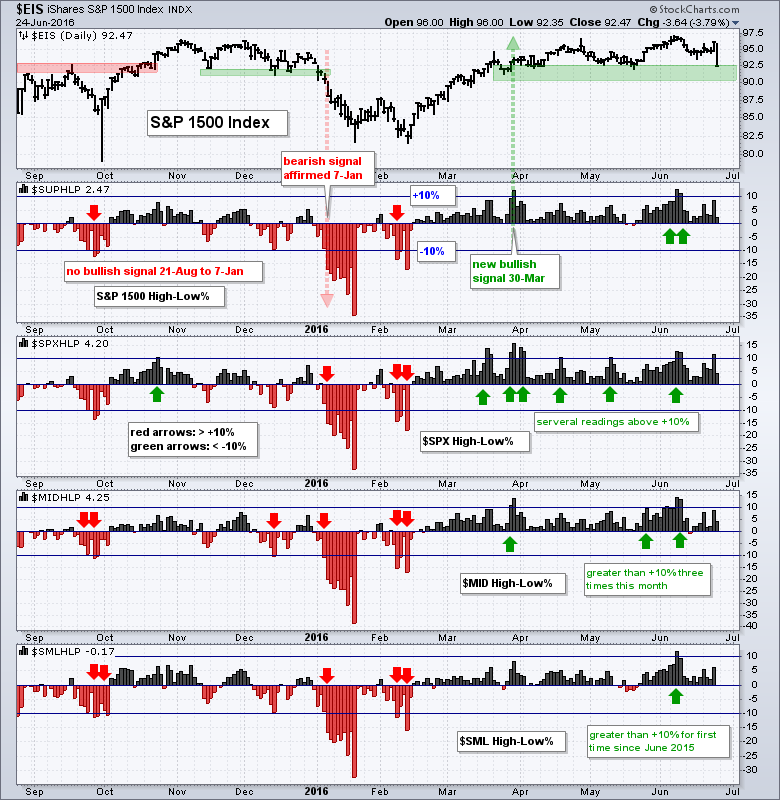
The 10-day EMA of AD Percent serves as my early warning indicator because it is usually the first to trigger. A move above +30% shows strong enough buying pressure to turn bullish, while a move below -30% shows strong enough selling pressure to turn bearish. The 10-day EMA for S&P 1500 AD Percent ($SUPADP) serves as the broad market indicator and I then break it down into the S&P 500, S&P MidCap 400 and S&P Small-Cap 600. The S&P 1500 indicator moved sharply lower on Friday, but remains well above the -30% threshold and this means more selling pressure is needed to trigger a bearish signal. The $SPX indicator remains just above the zero line, while the $MID and $SML indicators are just below the zero line. All three are well above -30%.
New Lows have yet to Expand
High-Low Percent turned bullish in late March when S&P 1500 High-Low Percent ($SUPHLP) moved above +10% and this indicator remains on a bull signal. Keep in mind that it takes an actual bear signal to reverse the bull signal. A bull signal does not reverse if High-Low Percent turns slightly negative. A move below -10% shows a serious broadening of selling pressure because it means new lows are expanding. This triggers a bearish signal.
%Above 200-day Near Bearish Signal for Nasdaq 100
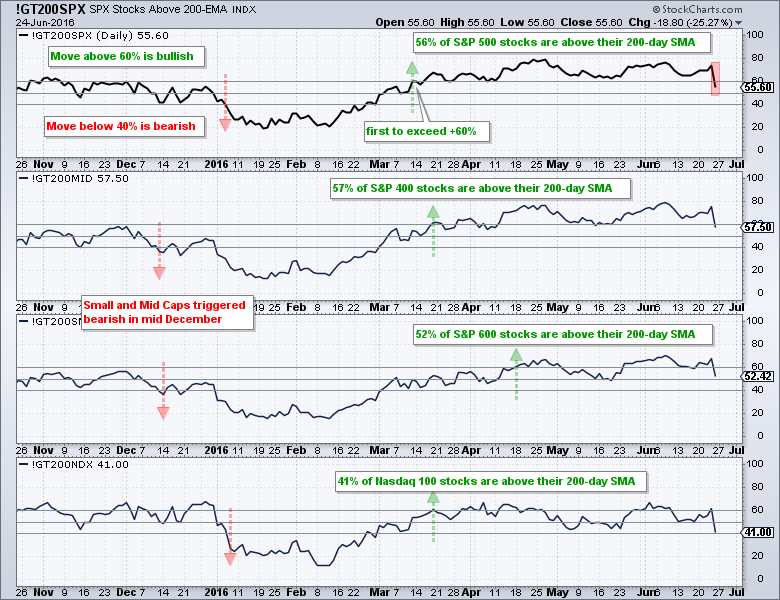
Fewer stocks are above their 200-day moving averages after Friday's sharp decline, but the indicator has yet to trigger bearish for the broad market indexes. The percentage of stocks above the 200-day stands as follows: $SPX 55.60%, $MID 57.5%, $SML 51.42% and $NDX 41%. The three broad indexes are above 50% and still relatively far from a bearish signal (move below -40%). $NDX, which is dominated by tech and biotech, is by far the weakest of the group and very close to turning bearish.
 The table below summarizes the signals shown on the charts above. Only one breadth indicator is currently bearish. The 10-day EMA of S&P 500 AD Percent ($SPXADP) did not trigger bullish on March 3rd because it fell just short of +30% (29.87%). The financial press is preparing us for a volatile summer, but I will simply watch this table and turn bearish when/if the evidence turns.
Consumer Discretionary Remains the Weakest Sector
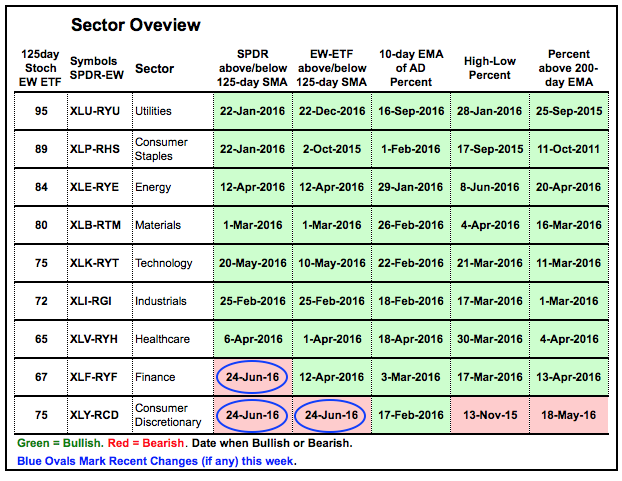
The table below summarizes these same indicators for the nine sectors. Consumer discretionary is by far the weakest of the nine. Two breadth indicators are in bear mode and both consumer discretionary ETFs are below their 125-day moving average. The finance is the second weaknest because the EW Finance ETF (RYF) is below its 125-day moving average. The rest of the sectors are still holding up and this supports the broad market uptrend. The trouble starts when half of this table turns red.
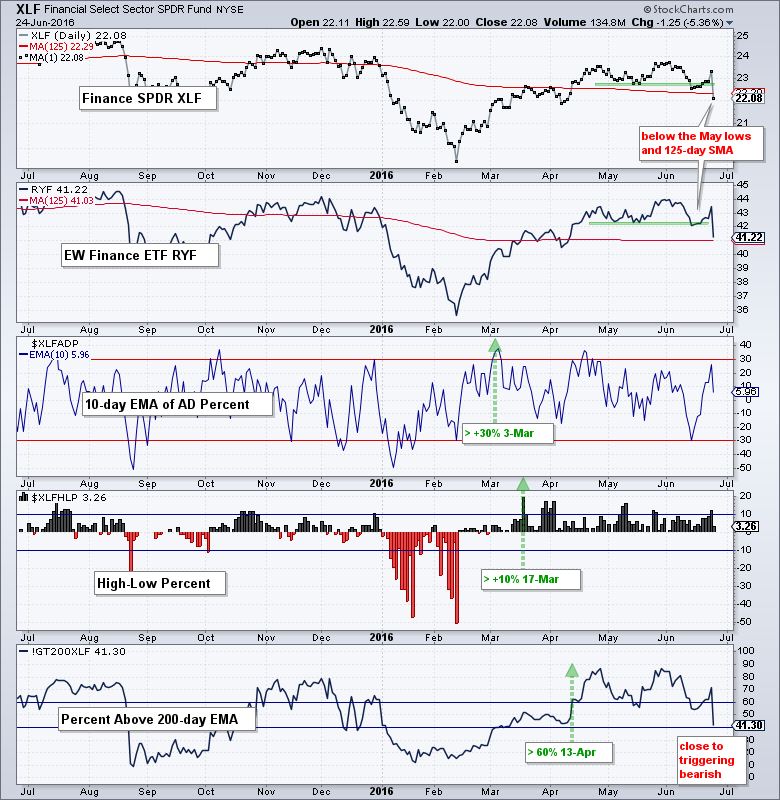
Finance Sector Weakens Considerably
The chart below shows these key indicators for the finance sector. The 10-day EMA of AD Percent almost triggered bearish in mind June, but stopped just short of breaking below -30%. High-Low Percent ended at +3.26% on Friday and there are still more new highs than lows. However, notice that Finance %Above 200-day EMA (!GT200XLF) plunged to 41.3% and this indicator is close to turning bearish.
 ******************************************************
Measuring Risk On-Risk Off - Using charts to quantify stock, economic and credit risk.
PPO Trading Strategy - How to use 3 PPOs to develop a trend-reversion trading strategy.
Long-term Trend Indicators - Using the PPO, EMA Slope and CCI to determine the trend.
ETF Master ChartPack - 300+ ETFs organized in a Master ChartList and in individual groups.
Follow me on Twitter @arthurhill - Keep up with my 140 character commentaries.
****************************************
Thanks for tuning in and have a good day!
--Arthur Hill CMT
Plan your Trade and Trade your Plan
*****************************************


