Oversold versus Panic OVERSOLD // IWM Holds the May Low // Housing and Retail Test Benchmark Lows // XSD Becomes Most Oversold // Revisiting the Sovereign Debt Crisis // Brexit View from Belgium //// .....
Oversold versus Panic Oversold
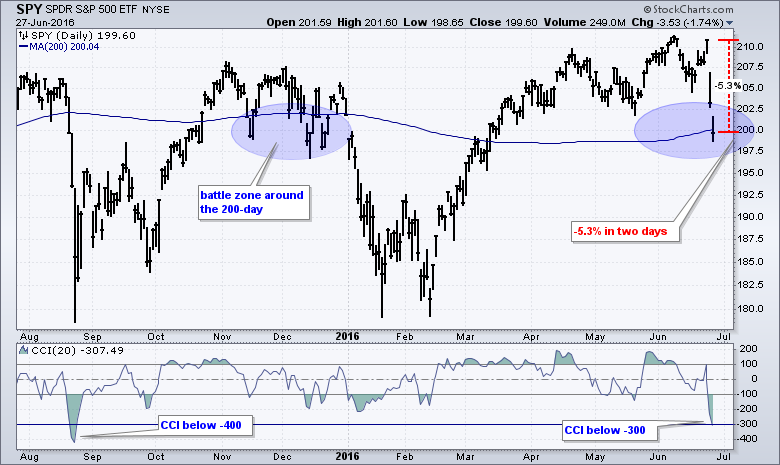
Stocks plunged the last two days and most are short-term oversold. Not just oversold, but panic oversold. Note that 20-day CCI for SPY dipped below -300 for the fourth time since May 2010, which was the flash-crash. The last big oversold reading occurred on August 21st when CCI dipped below -300. Stocks sold off again on August 24st and CCI ultimately dipped below -400. I do not know if -400 will be hit again, but SPY is clearly short-term oversold after the two day plunge and ripe for a rebound. Also notice that the ETF finished just below the 200-day SMA and this level often acts as a battle zone.
IWM Holds the May Low
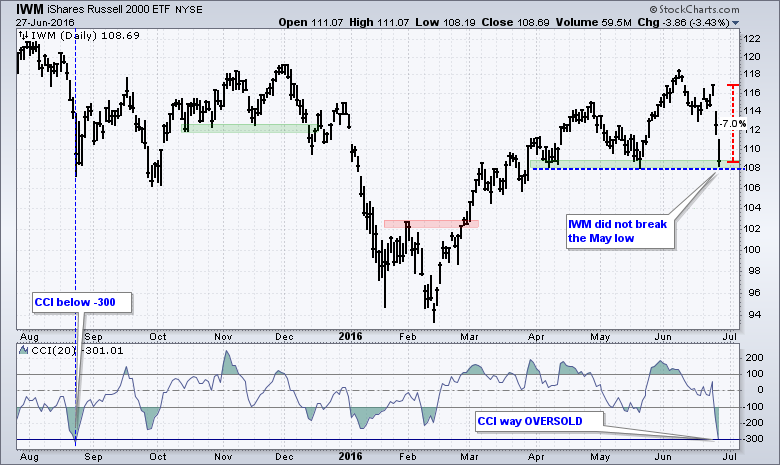
The May low marks a "benchmark" low that chartists can use to judge relative chart performance. Stocks and ETFs that held the May low show relative chart strength. Stocks and ETFs that broke the May low show relative chart weakness. SPY and QQQ clearly broke their May lows, but IWM did not break this low and held up better on the chart. Even though the ETF is down more than SPY over the last two days, I would prefer IWM to SPY because the chart held up better. CCI also dipped below -300 as IWM became the most oversold since August 24th.
Housing and Retail Test Benchmark Lows
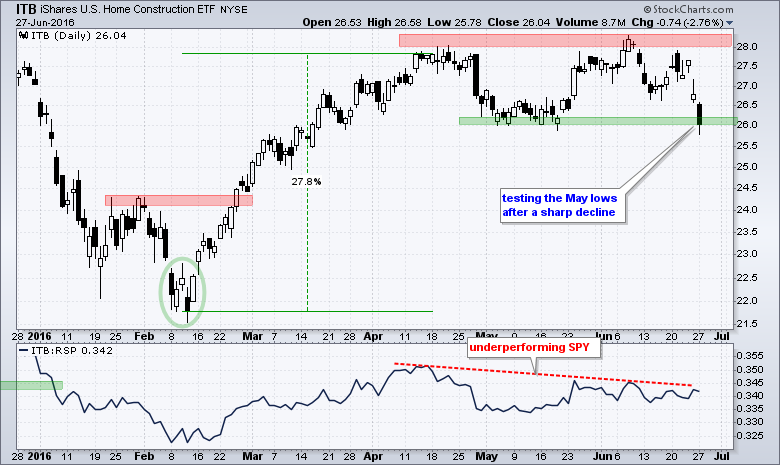
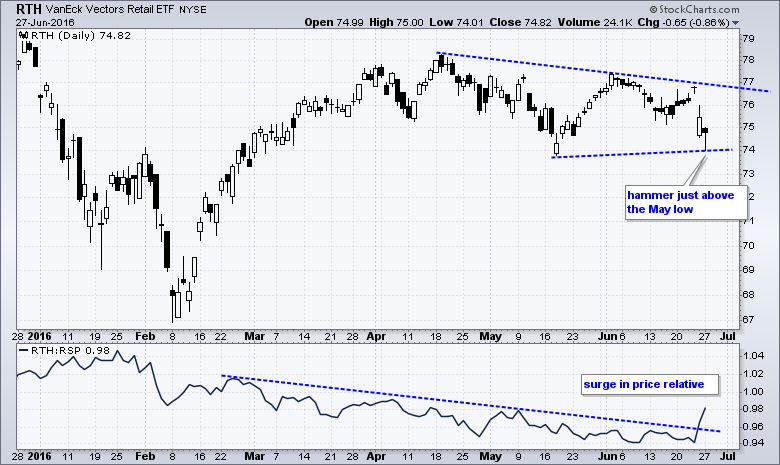
Consumer discretionary is one of the weakest sectors right now, but I am noticing some relative chart strength in the Home Construction iShares (ITB), the MarketVectors Retail ETF (RTH) and the Retail SPDR (XRT). Why? Because they are still near their May lows. ITB is testing the May low after a sharp two-day decline and remains in a trading range the last few months.
The MarketVectors Retail ETF (RTH) formed a hammer and held above the May low yesterday. Overall, the ETF surged from mid February to late March and then formed a long triangle consolidation.
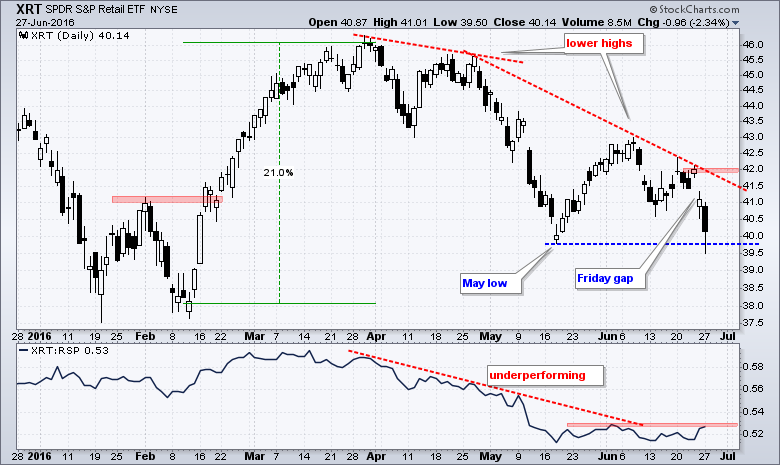
Even the lowly XRT held its own over the last six weeks as the price relative flattened (XRT:RSP ratio). The overall trend is still down and chartists should watch Friday's gap for the first sign of a recovery. A break above 42 would fill the gap and show resilience.
XSD Becomes Most Oversold
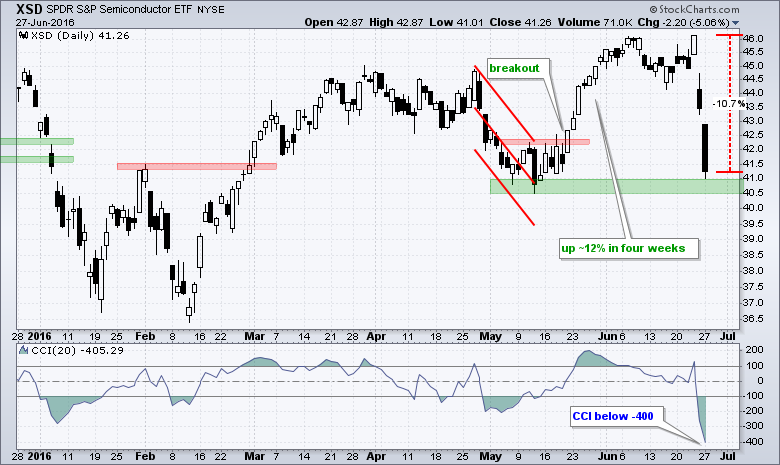
The Semiconductor SPDR (XSD) was one of the hardest hit ETFs with a 10% decline over the last two days. XSD was leading the market earlier this month and gave back its prior gains in just two days. The ETF is still above the May low and the most oversold in some 10 years. We can quantify this because CCI moved below -400 and this is the lowest level in over 10 years. This decline smacks of panic.
Revisiting the Sovereign Debt Crisis
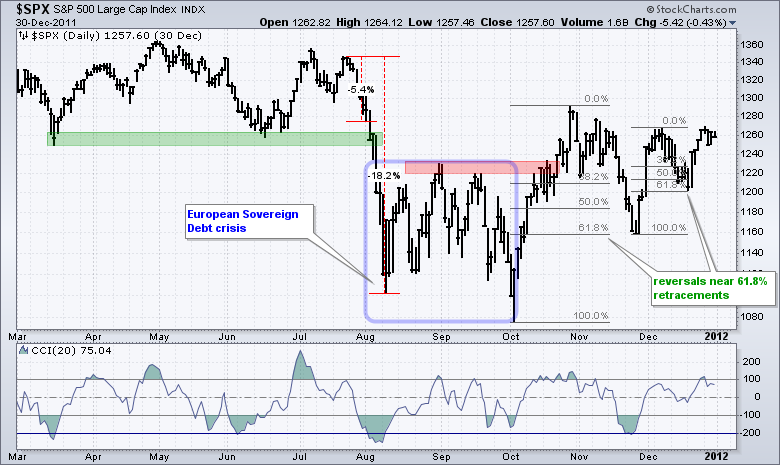
The European sovereign debt crisis was the last time European markets rattled global markets. In contrast to the current situation, this was a credit event with the possibility of debt defaults casting very dark clouds over the financial markets. The S&P 500 is currently down around 5.7% from Thursday's high to Monday's low (two days). The chart below shows when the S&P 500 was down around 5.4% in early August 2011. The index then fell another 13% for an 18% decline in 12 days. This is what a financial crisis looks like. It then took the index eight to nine weeks to stabilize and a breakout occurred in late October. Notice that the two pullbacks after the breakout reversed at the 61.8% retracements.
Brexit View from Belgium
I am deviating from the technical analysis for a take on Brexit. This is just a personal observation so take it with a grain of salt. For those that do not know, I lived in London for four years and now live in Belgium (12 years now). Nobody really knows how Brexit will play out, but I doubt that there will be a full Brexit. As far as the financial markets are concerned, this is not a credit event (Lehman) and it is not even on par with the European sovereign debt crisis in 2011.
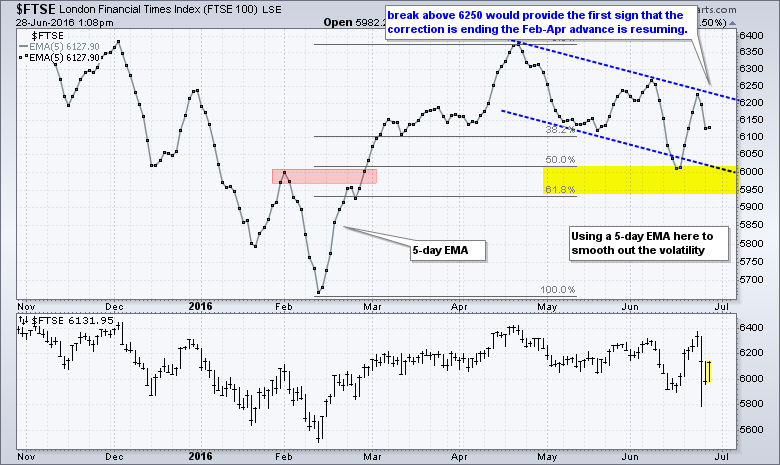
At this stage, I consider this a political event and we have yet to see the final result of the non-binding referendum. The resignation of David Cameron was actually quite shrewd because it bought time. The Conservative Party must now choose a new Prime Minister and this will take a few months (perhaps October). A formal decision to leave, therefore, could be taken in October at the very earliest. On the price chart, notice that the FTSE Index ($FTSE) is back near Friday's close already and back above the 6000 level.
Here is the current situation. Leave won the non-binding referendum. The House of Commons, however, has yet to pass a motion to leave the EU and the vast majority of MP's support remaining in the EU. The Prime Minister resigned and no longer has the authority to activate article 50 (formal request to leave). The Labour party is in disarray with a confidence vote on deck. The only thing that is clear is that the UK is in no position to make a formal decision to leave the EU at this time.
A lot can happen in the coming three to six months and the realities of leaving the EU are hitting home. The UK needs access to the European market and the EU needs the UK. Right now EU and UK leaders are just jawboning and nothing is really happening. Welcome to EU politics. This is going to drag out because both sides are hunkering down for future negotiations. Go back and review the Greek debt negotiations for a primer on EU deal making. The ball is in UK hands and the UK can wait as long as it wants before triggering article 50.
Again, nobody knows exactly how this will play out, but I do not think the UK will leave the EU completely. We could see a new referendum that would have more details and be binding. We could see new elections in the UK with politicians from both camps going head-to-head. This would be a de-facto second referendum. We could see long and drawn out negotiations on the future of the UK in the EU.
******************************************************
Measuring Risk On-Risk Off - Using charts to quantify stock, economic and credit risk.
PPO Trading Strategy - How to use 3 PPOs to develop a trend-reversion trading strategy.
Long-term Trend Indicators - Using the PPO, EMA Slope and CCI to determine the trend.
ETF Master ChartPack - 300+ ETFs organized in a Master ChartList and in individual groups.
Follow me on Twitter @arthurhill - Keep up with my 140 character commentaries.
****************************************
Thanks for tuning in and have a good day!
--Arthur Hill CMT
Plan your Trade and Trade your Plan
*****************************************


