S&P 500 Affirms Uptrend with Big Bounce // Short-term Smoothing Improves Returns and Reduces Drawdowns // QQQ leads Recover as IWM Forms Island Reversal // HealthCare SPDR Shows Some Resilience // EW Technology Holds May Low // Five Stocks to Watch: ORCL, CMCSA, ABBV, CERN and ZTS //// .....
S&P 500 Affirms Uptrend with Big Bounce
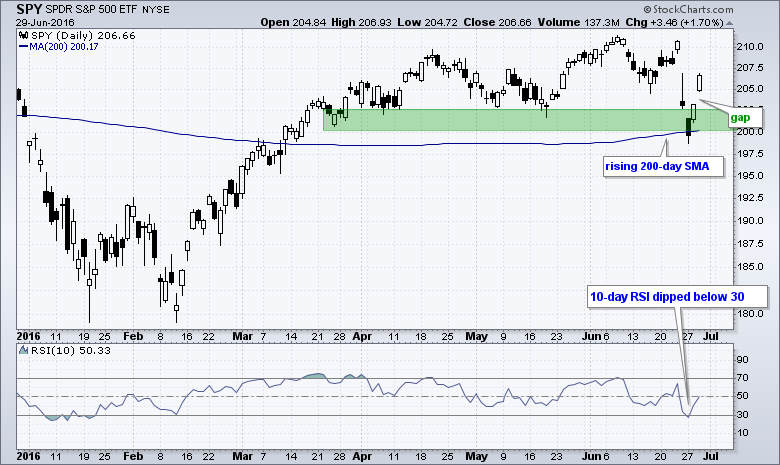
The S&P 500 SPDR (SPY) and the S&P 500 broke their 200-day moving averages on Monday and then surged right back above these "key" levels on Tuesday. Both followed through on Wednesday with further gains. It is almost as if the Brexit referendum never happened. I will tell you what never happened. The UK did not invoke article 50 and remains in the EU, just as it did before the referendum. Turning back to the chart, I do not really use moving averages to mark support or resistance, except for the S&P 500. This is the most widely followed benchmark and the 200-day moving average is perhaps the most widely used moving average. This makes it a bit of a self-fulfilling prophecy for the S&P 500. It seems to work because enough people follow this key moving average for this key benchmark.
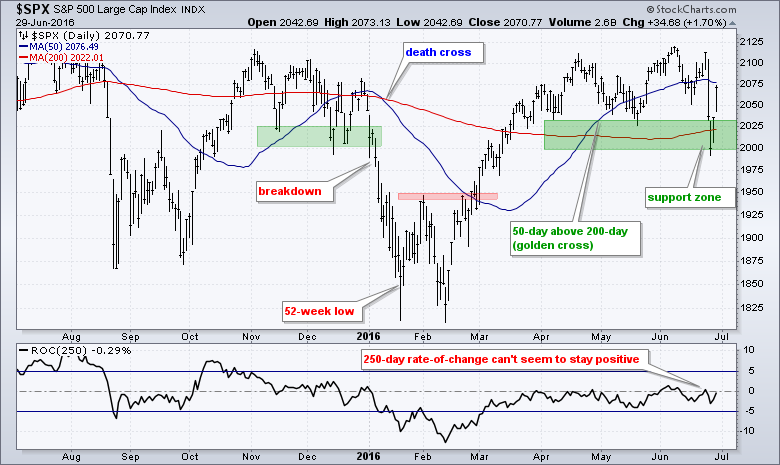
In any case, the SPY ultimately held its support zone in the 200-203 area and the S&P 500 held 2000. The surge over the last two days did not recoup the entire Friday-Monday loss, but the move was impressive and the bigger trend remains up. The S&P 500 held its support zone, the 200-day SMA is rising and the 50-day is above the 200-day. The late August death cross, late December golden cross and early January death cross resulted in whipsaws, but I do not think three bad signals are enough to invalidate the trading system. The current gold cross signal is still valid and I would re-evaluate if the index closes below 2000. Pullbacks are opportunities as long as this stock market benchmark remains in bull mode.
Short-Term Smoothing Can Improve Returns and Reduce Drawdowns
I ran a backtest of the S&P 500 with some different moving average crossovers using the 200-day as the long-term moving average. This test extends to from January 1990 to May 2016. I could go back to 1950, but I think 1990 is far enough because this period includes two bear markets. The first line shows results for buy-and-hold. The second line shows results if one bought on a close above the 200-day and sold on a close below the 200-day. Notice that the Win% (percentage of winners) is just 25%. This means 75% of the trades were losers and there were a lot of whipsaws. This system did not beat the Compound Annual Return for buy-and-hold, but it did beat the Risk-adjusted Return.
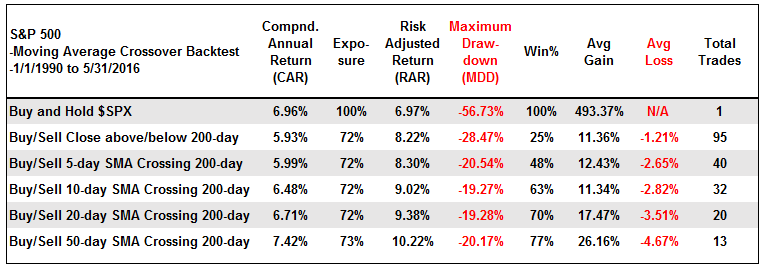 Smoothing closing prices with a short-term moving average improves returns and reduces drawdowns. The next lines show results using four different short-term moving averages (5-day, 10-day, 20-day and 50-day). Notice how the Compound Annual Return (CAR) increases as the short-term moving average increases. The drawdowns also dropped to the -20% range because there were fewer whipsaws (bad trades). The Win% also increased as the slow moving average increased. In fact, the golden cross (50-day crossing 200-day) had the highest Win%, the highest CAR and the highest average win. It was also the only system that beat buy-and-hold for the Compound Annual Return.
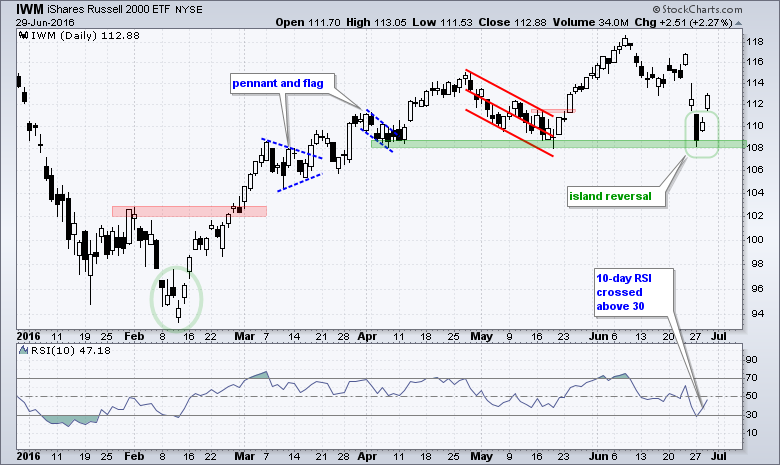
QQQ leads Recovery as IWM Forms Island Reversal
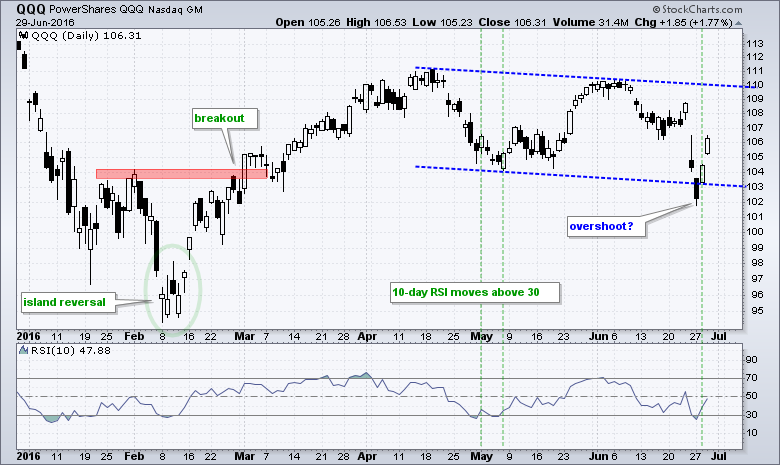
QQQ plunged below 103 on Monday and 10-day RSI dipped below 30 to become oversold. This lower low did not last long as the ETF surged back above 106 the last two days and RSI moved back above 30 on Tuesday. Note that QQQ led the major index ETFs with a 4% gain the last two days. The RSI cross is a short-term bullish signal for mean-reversion traders. Overall, QQQ remains within a larger falling channel and needs to break 110 to reverse this 11 week downtrend.
IWM held its May low on Monday, formed an inside day on Tuesday and gapped up on Wednesday. This gap created an island reversal over the last four days and traders establishing short positions on Monday-Tuesday are now trapped with losses. Technically, the island reversal is a short-term bullish pattern that remains valid as long as the gap holds. A close below 110 would fill the gap and call for a reassessment.
HealthCare SPDR Shows Some Resilience
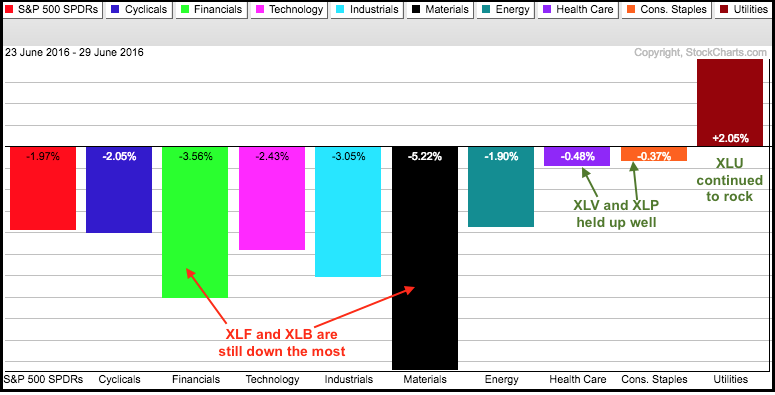
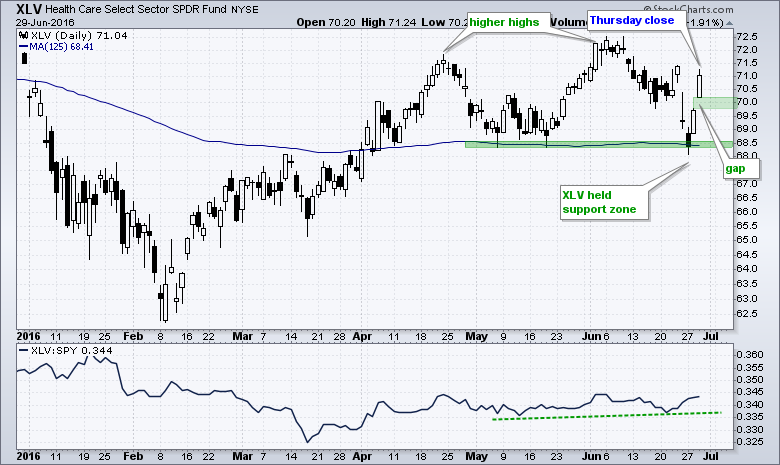
The markets went rather wild over the last four days with two big declines (Friday-Monday) and two big advances (Tuesday-Wednesday). The net result is still negative for the major index ETFs and most sectors. Stocks and ETFs that are net positive after these four days show some relative strength. The Utilities SPDR (XLU) and REIT iShares (IYR) are net positive and at new highs. Of the nine sectors, I noticed that the HealthCare SPDR (XLV) had an impressive recover the last two days and is down just .48% since Thursday's close.
The price chart shows XLV holding the May support zone and surging with a gap. The indicator window shows the price relative forming a slightly higher low from May to June. This means XLV slightly outperformed SPY.
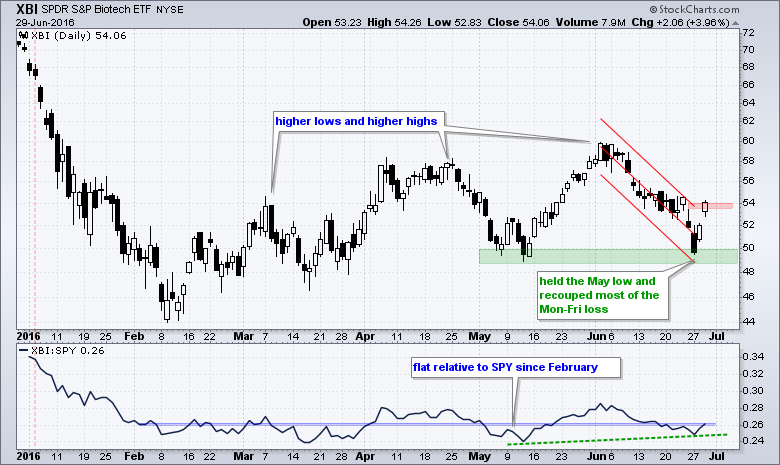
Healthcare got some help from beaten down biotechs as the Biotech SPDR (XBI) surged over 8% the last two days. Notice that XBI held its May low and recovered almost all the Friday-Monday loss. It is still a very risky group, but the higher highs and higher lows since March remain in play and this is a multi-month uptrend.
EW Technology Holds May Low
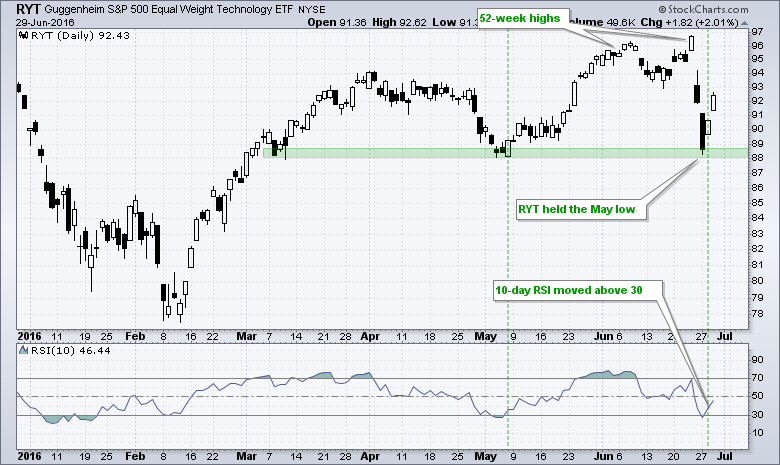
I also noticed some relative chart strength in the EW Technology ETF (RYT) and a number of tech ETFs this week. The May low marks a benchmark low that chartists can use when comparing charts. Stocks and ETFs that held the May low show relative chart strength. Stocks and ETF that broke the May low show relative chart weakness. RYT held the May low on Monday and surge over the last two days. This is a relatively thinly traded ETF that is best used for analysis purposes. As an equal-weight ETF, it is a good benchmark for the technology as a whole. Notice that RYT hit a 52-week high just last week. The bigger trend is clearly up as long as 88 holds on a closing basis. Elsewhere in tech-land, note that the Cloud Computing ETF (SKYY), Cyber Security ETF (HACK), Internet ETF (FDN), Software iShares (IGV) and Semiconductor SPDR (XSD) held their May lows.
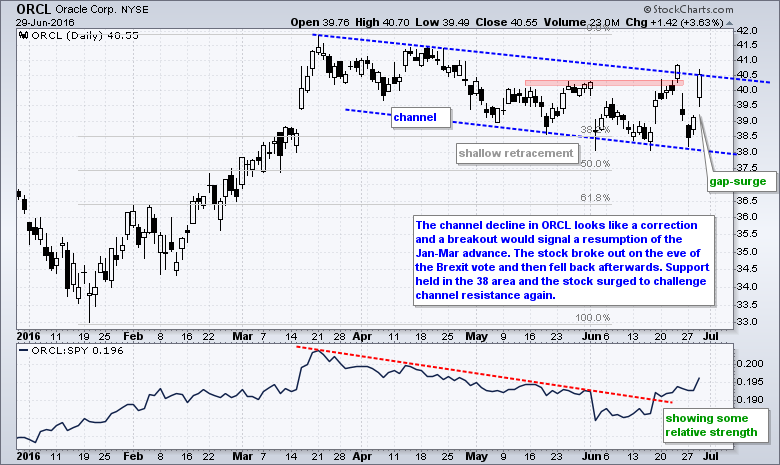
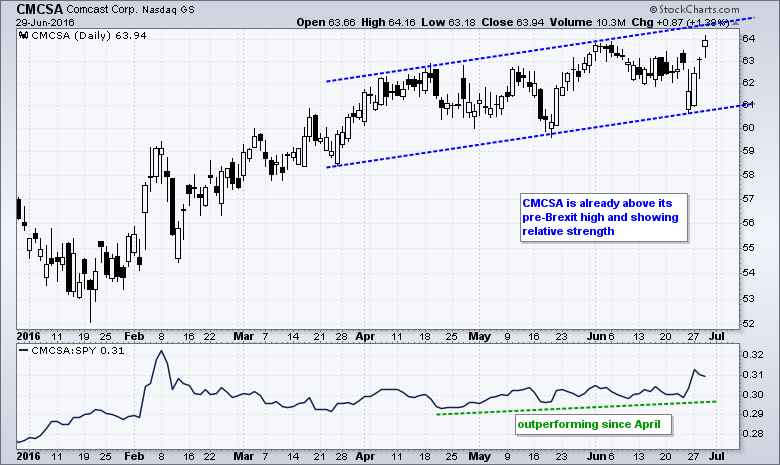
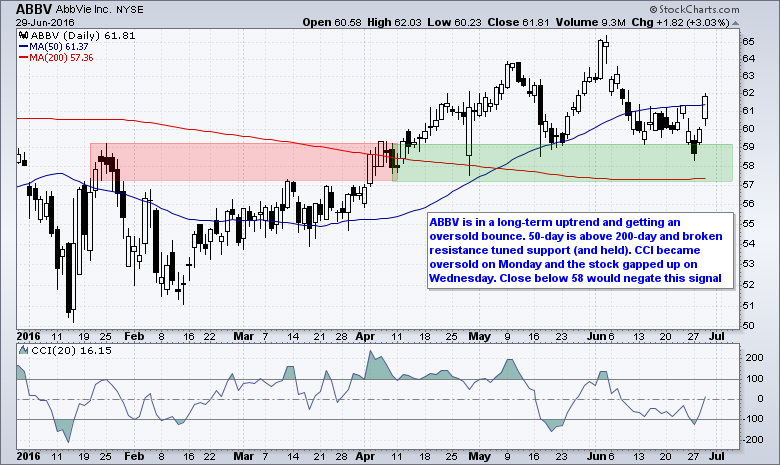
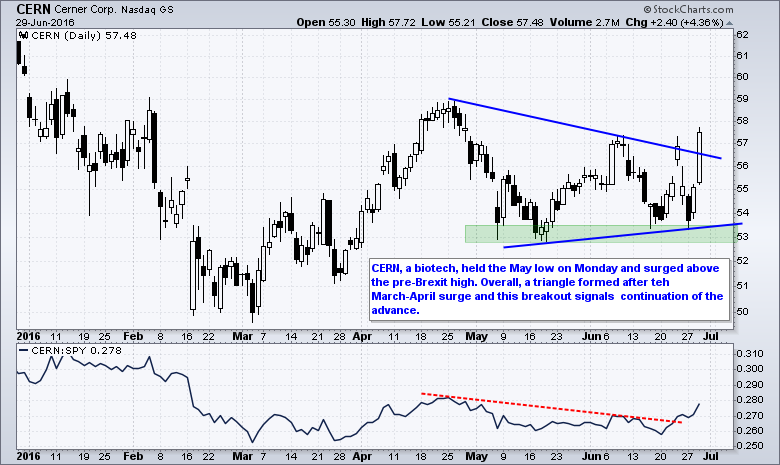
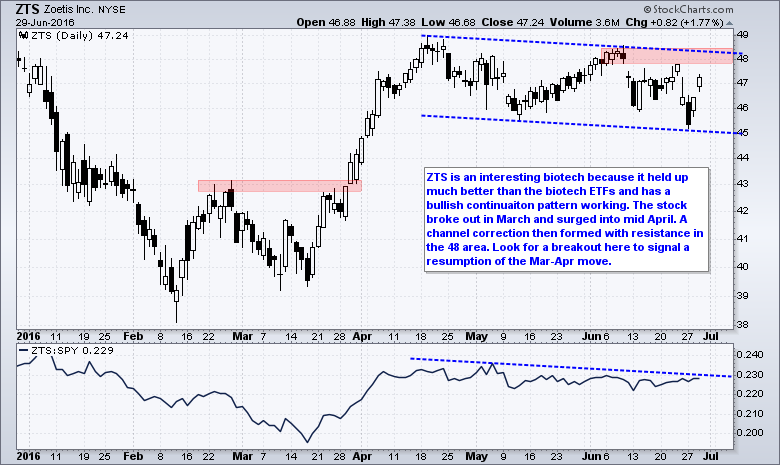
Five Stocks to Watch: ORCL, CMCSA, ABBV, CERN and ZTS
 ******************************************************
Measuring Risk On-Risk Off - Using charts to quantify stock, economic and credit risk.
PPO Trading Strategy - How to use 3 PPOs to develop a trend-reversion trading strategy.
Long-term Trend Indicators - Using the PPO, EMA Slope and CCI to determine the trend.
ETF Master ChartPack - 300+ ETFs organized in a Master ChartList and in individual groups.
Follow me on Twitter @arthurhill - Keep up with my 140 character commentaries.
****************************************
Thanks for tuning in and have a good day!
--Arthur Hill CMT
Plan your Trade and Trade your Plan
*****************************************


