Perspective on Last Week's Failed Rally // Lower High Takes Shape for Nasdaq 100 // Russell 2000 Earned the Right to Correct // Broad Selling hits key Breadth Indicator // New Highs Actually Expanded Last Week // Plunge in Yields Shakes up the Markets // .....
Perspective on Last Week's Failed Rally
Stocks did the old pop and drop last week as the S&P 500 exceeded 2120 on Wednesday and then closed below 2100 on Friday. Last week's price action was not encouraging for the bulls, but it is not enough to turn bearish on the market. Today I will look at some weekly charts to put recent price action into perspective. Note that the S&P 500 surged over 12% from mid February to mid April and then corrected with a falling flag in May. The index broke flag resistance with a long white candlestick and closed near 2100. This breakout and surge are still holding and I am marking first support at 20.47, which is the low of the long white candlestick. A close below this level would negate the breakout and provide the first sign of significant selling pressure. Any weakness above this level is deemed daily noise and short-term in nature.
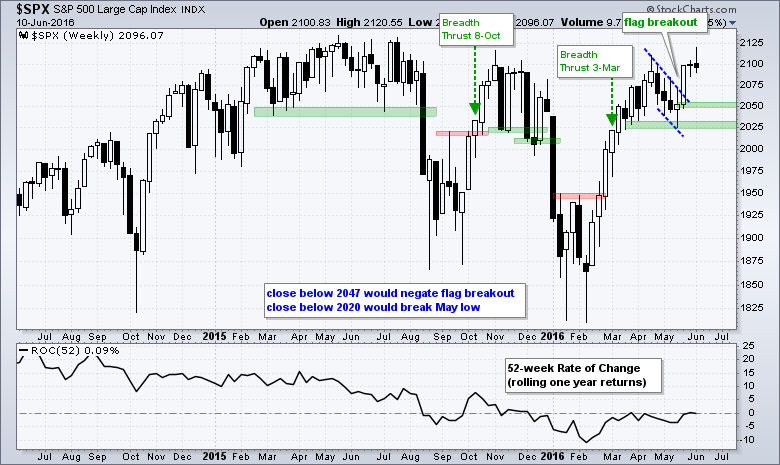
I marked the bullish breadth thrusts on the chart for reference and I will show the breadth indicators a little later in the commentary. Long-term, I am marking price chart support at 2020, which is near the May low. The series of higher highs and higher lows since the February breakout remains in play as long as this low holds. A weekly close below 2020 would forge a lower low and reverse the uptrend that began with the February breakout.
Lower High Takes Shape for Nasdaq 100
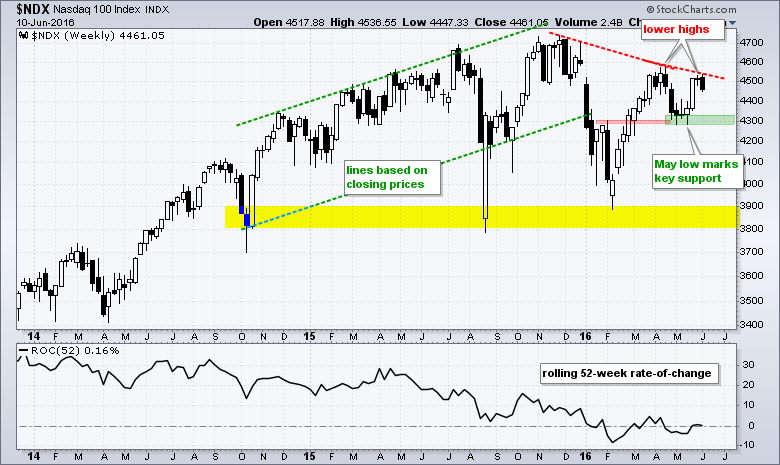
The Nasdaq 100 is showing some relative weakness because it failed to reach its 2015 highs in April and could be forming another lower high now (below the April high). Broken resistance and the May lows combine to mark support in the 4300 area. A weekly close below the May lows would reverse the uptrend here and argue for a decline towards the 3800-3900 area. Keep in mind that I am bullish on the Nasdaq 100 right now and I am trying to determine what would prove this stance wrong.
Russell 2000 Earned the Right to Correct
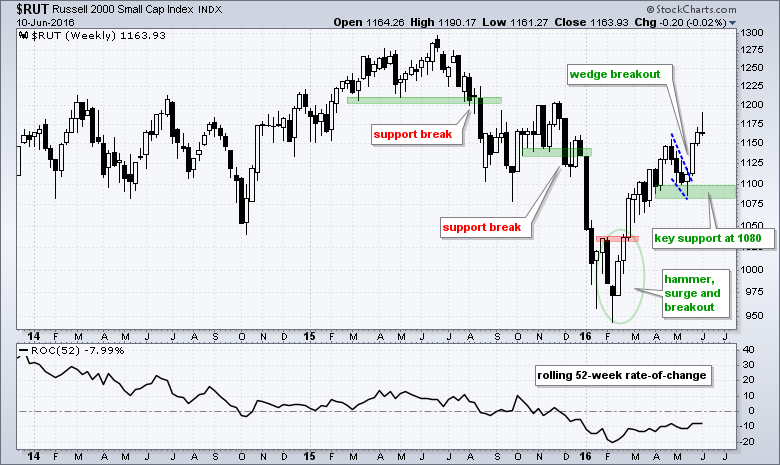
The Russell 2000 led the market higher over the last four weeks and remains in an uptrend since the February breakout. The wedge breakout was the most recent signal and the index surged over 5% in four weeks. A rest or corrective period would be quite normal after such a surge. Using the May low, I will mark support in the 1080-1100 area. A weekly close below 1080 would be enough to reverse the overall uptrend.
Broad Selling hits key Breadth Indicator
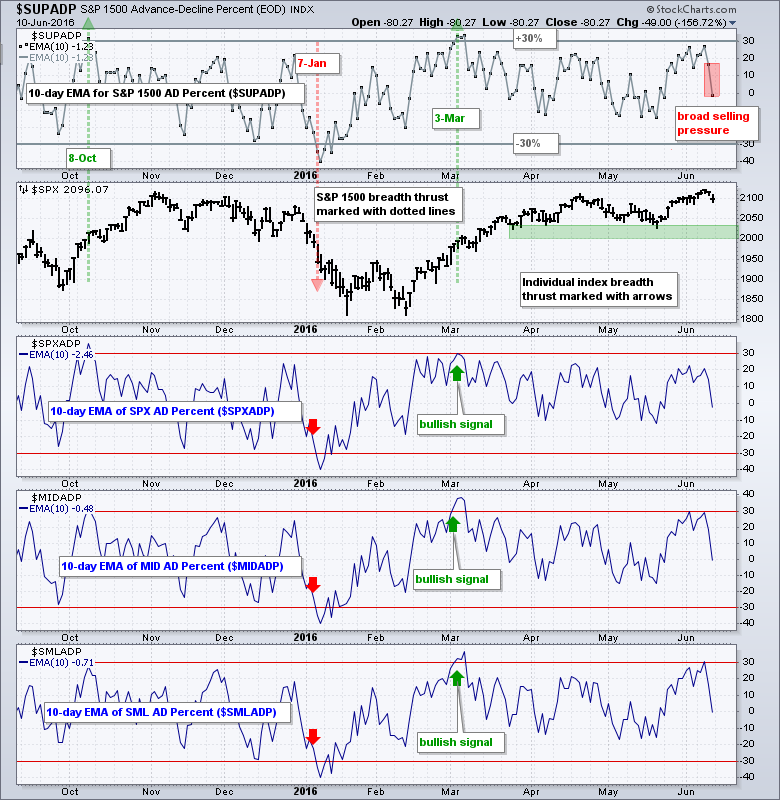
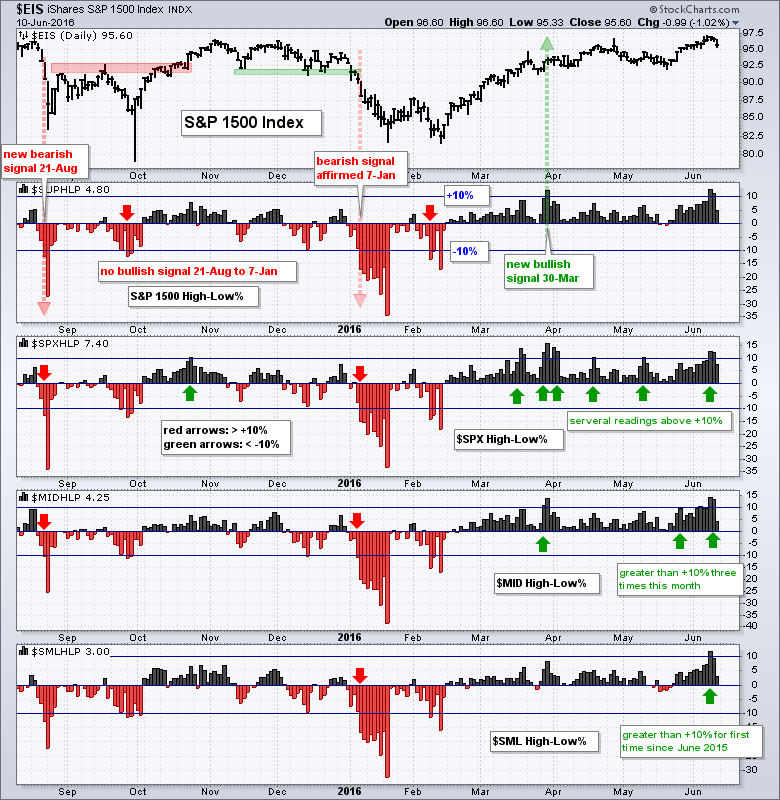
Selling pressure on Friday was very broad, but not enough to turn the breadth indicators bearish. The chart below shows the 10-day EMA for AD Percent for the S&P 1500, S&P 500, S&P MidCap 400 and S&P Small-Cap 600. A bullish signal triggers with a move above +30% and remains in play until a move below -30%, which triggers a bearish signal. S&P 1500 AD Percent ($SUPADP) is used for broad market signals and the current signal is bullish (3-Mar). As the chart shows, selling pressure was quite broad on Friday as the 10-day EMA fell from the +17% area and crossed into negative territory. This is, however, just one day and follow through selling pressure is needed to trigger a bearish signal (below -30%).
New Highs Actually Expanded Last Week
Even though the market sold off hard on Friday, new highs surged during the week and this indicator remains on a bull signal. A bull signal triggers when High-Low Percent moves above +10% and remains in play until a move below -10%. The S&P 1500 HiLo% ($SUPHLP) is used for the broad market signal and this triggered bullish in late March. Notice that S&P 500 HiLo% ($SPXHLP) triggered bullish in mid March and S&P 400 HiLo% ($MIDHLP) triggered bullish in late March. S&P 600 HiLo% ($SMLHLP) finally triggered bullish last week with the first move above +10% since June. This is a medium to long term indicator that will remain bullish until it moves below -10%.
Plunge in Yields Shakes up the Markets
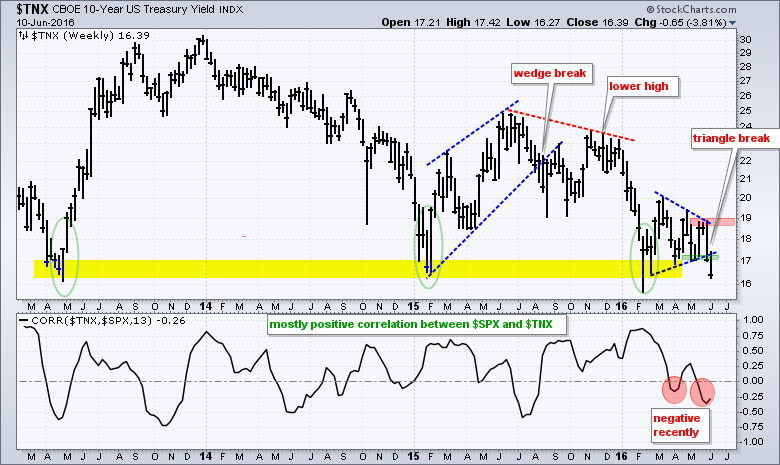
The plunge in the 10-YR Treasury Yield ($TNX) was the biggest event in the markets over the last two weeks. In general, the decline in yields is negative for the Dollar, the finance sector, the S&P 500 and the Nikkei 225. In contrast, it is usually positive for gold and stocks with dividends. $TNX broke the triangle trend line two weeks ago and plunged below 16.5 (1.65%) last week. Even though the yield bounced in the 16-17 area three times in the last three years, I think the triangle break is the dominant signal right now and it is bearish for Treasury yields (bullish for bonds).
The plunge in treasury yields also means Treasury bonds surged and Treasury bonds are safe-haven assets. The 7-10 YR T-Bond ETF (IEF) broke triangle resistance with a surge the last two weeks and this signals a continuation of the surge earlier this year. The April-May lows mark key support.
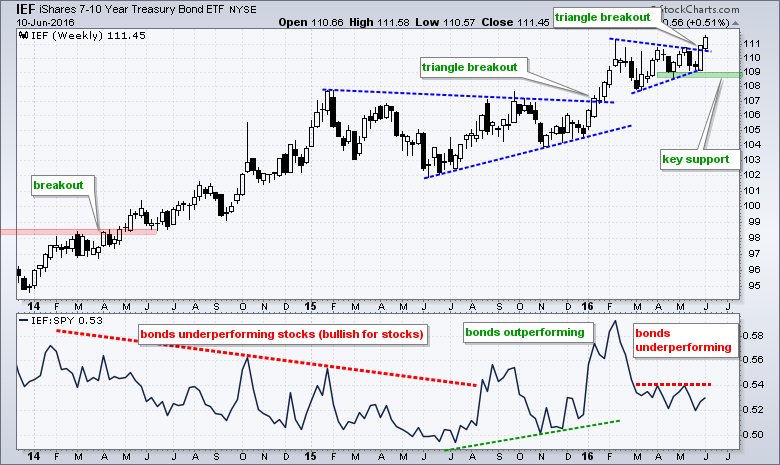
While a surge in bonds is often negative for stocks, note that bonds are still underperforming stocks and we have yet to see a shift in this key relationship. The indicator window shows the IEF:SPY ratio with three periods: bonds underperforming stocks, bonds outperforming stocks and bonds underperforming stocks. Bonds have been underperforming stocks since February and this is bullish for stocks overall. The IEF:SPY ratio flattened the last two months, but we have yet to see an upside breakout that would show relative strength in bonds. Such a breakout would show a clear preference for bonds and this would be negative for stocks.
In a separate, but related note....the upcoming Brexit vote on June 23rd could be affecting the macro environment. It is the biggest uncertainty in the markets right now. This could be pushing money into safe-haven US Treasuries and gold. It could also keep stock buyers on the sidelines until this vote is over.
******************************************************
Measuring Risk On-Risk Off - Using charts to quantify stock, economic and credit risk.
PPO Trading Strategy - How to use 3 PPOs to develop a trend-reversion trading strategy.
Long-term Trend Indicators - Using the PPO, EMA Slope and CCI to determine the trend.
ETF Master ChartPack - 300+ ETFs organized in a Master ChartList and in individual groups.
Follow me on Twitter @arthurhill - Keep up with my 140 character commentaries.
****************************************
Thanks for tuning in and have a good day!
--Arthur Hill CMT
Plan your Trade and Trade your Plan
*****************************************


