SystemTrader // Testing a Basic Mean-Reversion System // Tweaking RSI for Sensitivity // Setting the Ground Rules // Mean Reversion Scan Code // Buy the Falling Knife // Buy after the Bounce // And the Best System Is.... // A Portfolio with No Exceptions // Would You have the Guts? // Further Study //// ........
Testing a Basic Mean Reverions System
Today we are going to put a simple RSI mean reversion trading system to the test. The results may just surprise, especially when you see the rules. Mean reversion trading systems look to profit from extreme moves away from the existing trend. There are several types of mean reversion systems with most using a momentum oscillator to identify short-term overbought or oversold conditions.

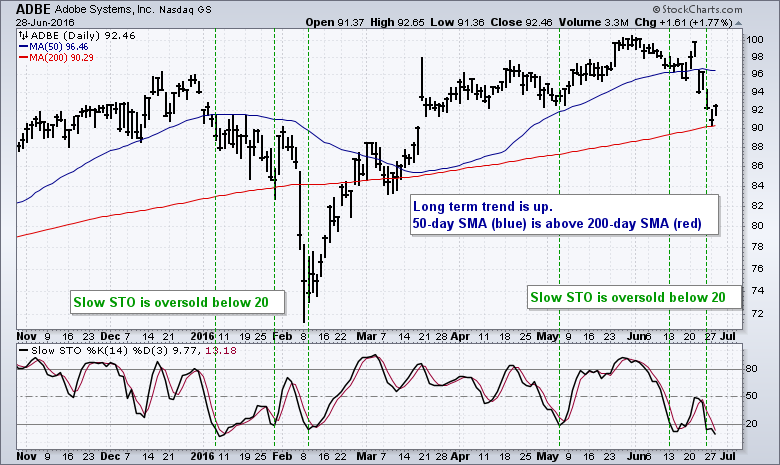
For example, one could look for short-term oversold conditions when the bigger trend is up. The chart below shows Adobe Systems with the 50-day SMA, the 200-day SMA and the Stochastic Oscillator. The trend is up when the 50-day is above the 200-day and the stock is considered short-term oversold when the Stochastic Oscillator dips below 20 (green lines).
With dozens of trend indicators and momentum oscillators available for such analysis, there are literally hundreds of combinations for backtesting. RSI is one of my favorite momentum oscillators for identifying overbought and oversold levels. I also like CCI and StochRSI. As such, I am going to test RSI to see if there is any edge to be gained by buying near oversold levels and selling near overbought levels.
Corrected Version: This article was initially published on 1-July-2016 and was corrected on 27-July-2016 after some database discrepancies were found. The goal is to test historical constituents for the S&P 500. The first test run did not fully capture the historical changes and this resulted in slightly higher returns. I have since fixed this database issue and the following results are based on the real historical constituents of the S&P 500. The overall results are still good and RSI is still a good indicator for mean-reversion strategies.
Tweaking RSI for Sensitivity
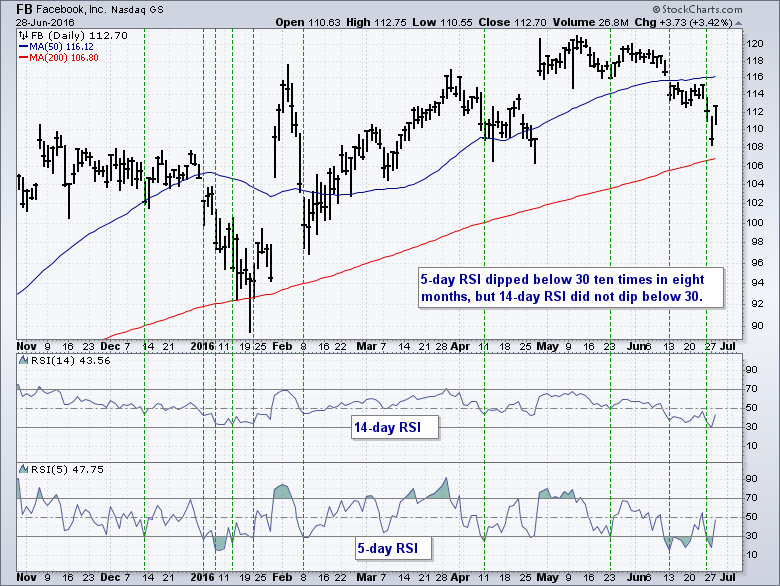
The look-back period for RSI will influence the number of overbought and oversold readings - and hence the number of signals. Traditional 14-period RSI will not produce many overbought or oversold readings (above 70 or below 30). Chartists, therefore, need to shorten the timeframe to increase sensitivity. The chart below shows Facebook with 14-day RSI and 5-day RSI. Notice that 5-day RSI became oversold a lot more often than 14-day RSI. Chartists looking for more trades and shorter timeframes should opt for 5-day RSI. Chartists looking for fewer trades and slightly longer timeframes may opt for 14-day RSI. The parameter settings are a matter of personal preference and trading style. Personally, I think 14-day RSI is not sensitive enough and the signals are too infrequent.
Setting the Ground Rules
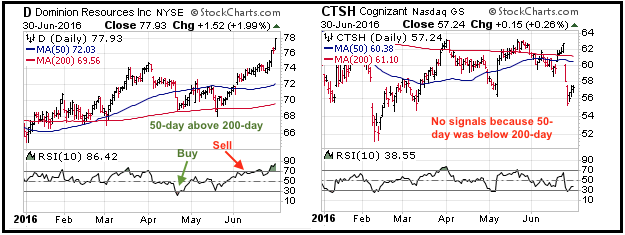
I will test three different RSI timeframes (5, 10 and 14 day) and two different buy points. First, simply buy when RSI moves below 30 and becomes oversold. This seems like an attempt to catch a falling knife, but the results may surprise. The chart below shows Dominion Resources with the 50-day above the 200-day, a buy signal in April and a sell signal in June. Cognizant did not trigger any signals because the 50-day was below the 200-day.
The second strategy is to let RSI dip below 30 and then buy when RSI crosses back above 30. This is like waiting for the knife to bounce. When there are too many buy signals, I will use the lowest value of RSI to break the tie. Commissions were $10 per trade.
The sell signal occurs when RSI moves above 70. Again, this may not seem intuitive, but short-term mean reversion systems often produce better results with set exits (as opposed to trailing stops).
In addition to the RSI signal settings, we also need some trend rules and portfolio rules. I added a broad market (S&P 500) trend rule and a stock trend rule. The 50-day SMA needs to be above the 200-day SMA for both the index and the stock. The backtests run from 1/1/1990 to 5/31/2016 and includes historical constituents for the S&P 500. This 25+ year period covers two bear markets, some big bull runs and a few trading ranges. The portfolio consists of 20 equally weighted positions (5% per position).
Mean Reversion Scan Code
[group is SP500]
AND [SMA(50,Close) > SMA(200,Close)] // 50-day is above 200-day
AND [30 x RSI(5)] // RSI(5) crosses below 30
We cannot scan for the S&P 500 specifically so chartists simply need to know if the 50-day SMA is above the 200-day SMA.
Buy the Falling Knife
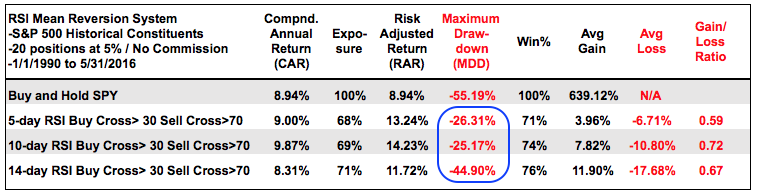
The table above shows results for the RSI mean reversion system that buys when RSI crosses BELOW 30 and sells when RSI crosses above 70. The system does not wait for a bounce or some sort of reversal and there are no trailing stops. Simply buy when RSI crosses below 30 and sell when RSI crosses above 70. 5-day RSI fared the best with a Compound Annual Return of 9.52%, a Risk-adjusted Return of 14.06% and a Maximum Drawdown of 21.49%. The Risk-adjusted Return is highest because the systems were invested 68-72% of the time (exposure).
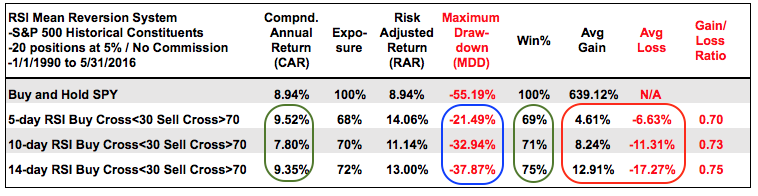 Notice how the average gain/loss and the Maximum Drawdown increased as the RSI timeframe increased from 5 to 10 to 14 days (blue oval). This is to be expected because of longer holding periods. The Maximum Drawdowns were still better than buy-and-hold, but the drawdowns for 10-period RSI and 14-period RSI were above 30% (too high). The downside of this system is that the average gain was less than the average loss in all cases. Nevertheless, this system is profitable because of the high win percentage.
Buy after the Bounce
Perhaps we can improve the results by waiting for a bounce and buying when RSI crosses back above 30. The table below shows results using the same RSI settings, buying on a cross back above 30 and selling on a cross above 70.
 The numbers were virtually unchanged for 5-period RSI, but the Compound Annual Return and Maximum Drawdown improved significantly for 10-day RSI. This improvement suggests that it is better to wait for a bounce in RSI when using 10 days.
And the Best System Is....
The next table shows all the results sorted by the average number of trades per year. The system ran from 1/1/1990 to 5/31/2016 and this extends 26.4 years. The number of trades declines as the number of RSI periods increases (red arrows). This is to be expected. Also notice that the number of consecutive losing trades declines as the RSI period increases. Chartists trading the 5-day RSI system would have endured 19 losing trades in a row. The system was still profitable, but it would have been hard to stick with the system after this many losing trades.
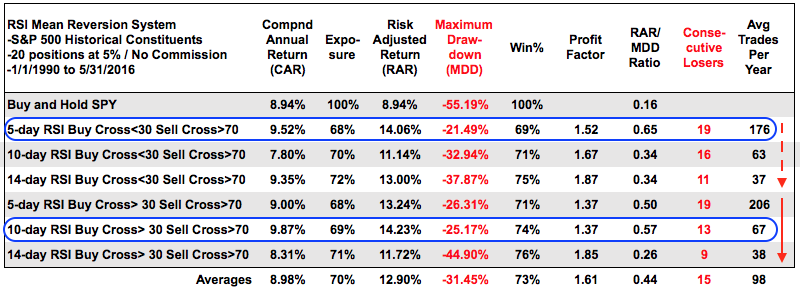 There are two systems that stand out. First, buy when 5-day RSI crosses below 30 and sell when RSI crosses above 70. The Compound Annual Return was 9.52%, the Risk-adjusted Return was 14.06% and the Maximum Drawdown was the lowest. Second, buy when 10-day RSI crosses back above 30 and sell when RSI crosses above 70. This system had the highest returns, but the Maximum Drawdown was around 25%.
A Portfolio with No Exceptions
Keep in mind that the backtest results are based on taking every trade and following the rules. No exceptions. Thus, cherry picking the signals would likely lead to different results. Sticking to a trading system and following the rules is perhaps the biggest challenge. Even though this system was profitable over a 25 year period, there were some tough years when the systems were not profitable. In particular, 2015 was a negative year as the trading systems lost around 10%.
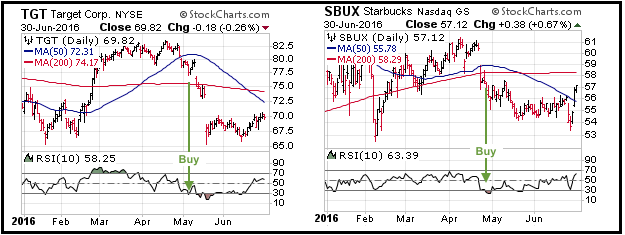
Some falling knives will continue to fall. The charts below shows two bullish signals in TGT and SBUX. The 50-day SMAs were above the 200-day SMAs and RSI(10) moved below 30 to trigger a buy signal (green arrows). The stocks, however, continued to fall. If sticking to the system, a sell signal will not trigger until RSI moves above 70. This will eventually happen, but the biggest risk is that the stock goes to zero before this happens. The chances of this are quite slim, even with stocks like Enron and Valeant.
The trading systems were also tested using a portfolio of stocks (signals). Truth be told, we do not know which signals will result in the biggest winners and which will result in the biggest losers. This system shows that a portfolio of signals can be profitable, even if this system does not successfully backtest on an individual stock.
The trading systems tested did not always have 20 trades so the trade totals would likely be higher if tested with a bigger universe, such as the Russell 3000. These backtests used stocks in the S&P 500, which are highly liquid large-caps. Small-caps and mid-caps have different characteristics than large-caps and this means the same systems will likely yield different results. I will save those tests for another day.
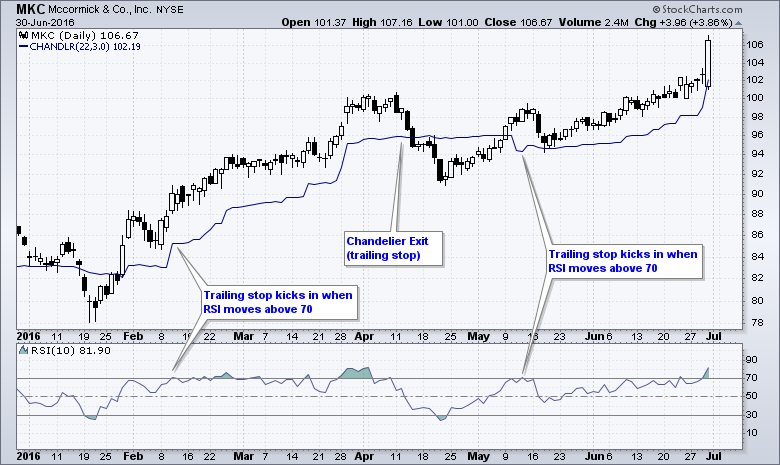
Overall, I think this is a pretty good starting point for a trading strategy. Mean reversion systems can also be used to build a position in stocks that are in uptrends. For example, an investor wanting to own a certain stock could use RSI to time pullbacks within an uptrend. Chartists may also consider adding a trailing stop after RSI crosses above 70 to capture larger trend movements. The MKC chart below shows how chartists can capture trend by using Chandelier Exit after RSI moves above 70.
Would You have the Guts?
I was looking through some of this week's signals and thought the Textron signal looked especially gutsy. First note that there were over 100 signals this week for RSI(10) and RSI(5), and 57 signals for RSI(14). Most of these signals occurred when RSI moved below 30 on Monday. TXT triggered a bullish signal on June 24 when RSI(10) moved below 30. Note that the 50-day crossed above the 200-day a few days prior. This bullish signal occurred with a gap down and the actual buy was on another gap down (open on June 25th).
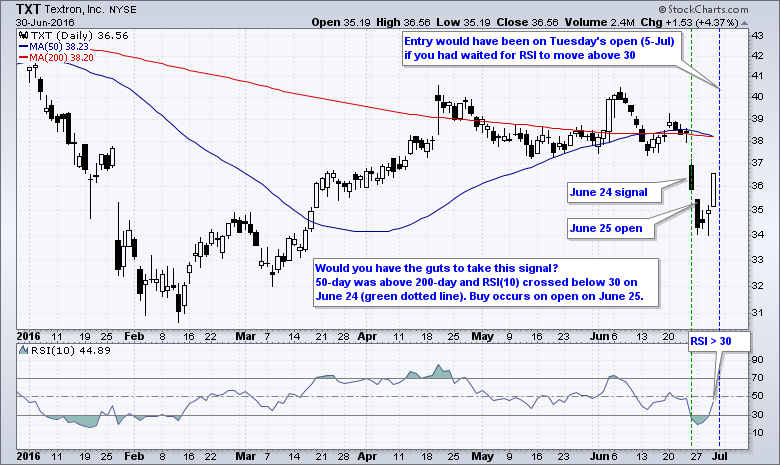
The system would have taken this signal because the rules were met. End of story. A traditional chartist (like me) would likely have balked because of the gap and break down. The system trader would be looking good after the Thursday-Friday surge and showing a small profit. The traditional chartist would see the short-term reversal on the price chart and possibly consider an entry on Tuesday. This highlights the difference between a totally systematic approach and one relying on a subjective chart interpretation.
Further Study
The inspiration for this trading system came from the 2-period RSI system, which was developed by Larry Connors and Cesar Alvarez. You can read more about the 2-period RSI system in our ChartSchool article. You can also read more about trading systems and RSI(2) at AlvarezQuantTrading.com. Cesar has a free blog with posts on trailing stops, scaling and, of course, RSI(2). These trading strategies were tested using Amibroker with the help of Cesar Alvarez. Click here for more information about his testing and consulting services.
******************************************************
Other Articles in the SystemTrader Series:
- Introduction to Key Performance Metrics - Quantifying the Golden Cross for the S&P 500
- Golden Cross and 5 Major Indexes - EMAs versus SMAs - Do Short Positions Add Value?
- Short-term Moving Average Crosses - Differences in Major Indexes - Do Trend Filters Work?
- MACD Crosses - Rules to Reduce Drawdowns and Increase Gains - Testing PPO Strategy
Follow me on Twitter @arthurhill - Keep up with my 140 character commentaries.
******************************************************
Thanks for tuning in and have a good day!
--Arthur Hill CMT
Plan your Trade and Trade your Plan
******************************************************


