Finance Sector Weighs on Broader Market // Using Vortex Indicators with SPY // QQQ Lags with Lower High // A Choppy Advance for IWM // 5-yr Yield hits 2016 Low // Oil Falls within Rising Channel // New High, New Low and Back Again // Large-cap Techs Weigh on XLK // Aluminum Surges to High of the Year // Alcoa and Kaiser Bounce along with Aluminum //// .....
Finance Sector Weighs on Broader Market
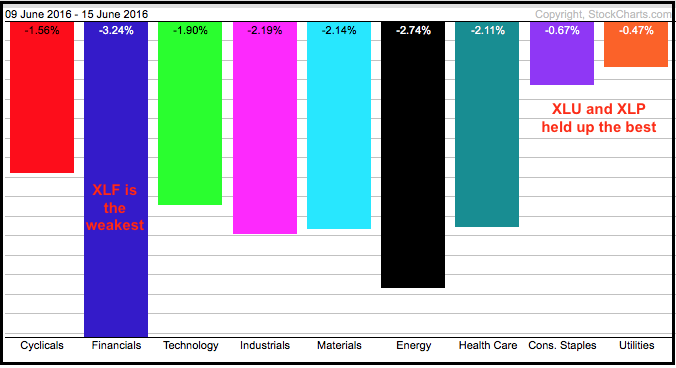
bearish currents gained the upper hand this week with broad selling pressure over the last four trading days. While I do not see enough evidence to turn bearish on the medium-term, I would be concerned short-term because finance is leading the way lower. Finance is the second biggest sector in the S&P 500 (~15.43%) and financial services is the largest sector in the Russell 2000 (26%). The PerfChart below shows XLF falling over 3% the last four trading days. XLU and XLP are down the least as the defensive sectors held up the best.
Using Vortex Indicators with SPY
The S&P 500 SPDR (SPY) chart shows a sharp advance from mid February to late March and then a choppy advance since early April. The April-May lows mark a clear support zone in the 204 area and these lows hold the key to the medium-term uptrend. In theory, SPY could pullback to the 205-206 area and still be within the confines of a choppy uptrend.
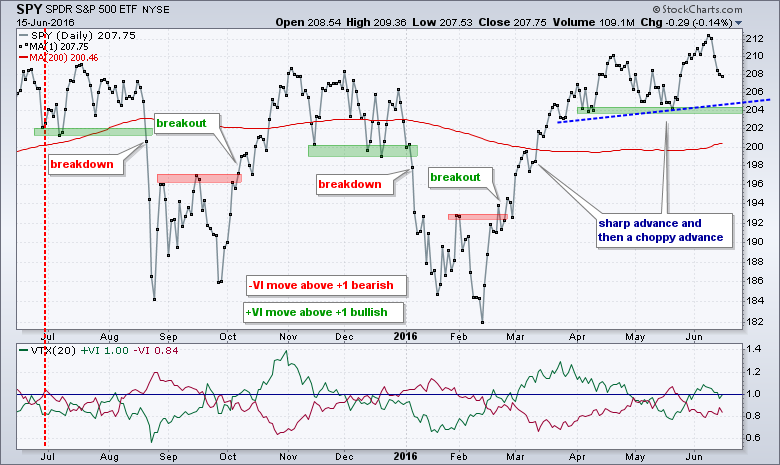
The indicator window shows the Vortex brothers (+VI and -VI). These indicators compare highs and lows, and use the Average True Range (ATR) to measure positive trend and negative trend. I am using 20 days because this represents a month. The pair has a bullish bias when +VI (green) crosses above -VI (red) and a bearish bias when -VI crosses below +VI. There can be quite a few crosses so I also look for a cross above 1 to confirm any signal. A bullish signal triggered in mid February, a bearish signal in mid May and a bullish signal in early June. This indicator is not immune to whipsaws and will remain on a bullish signal until -VI moves above +VI and exceeds 1. You can read more about the Vortex in our ChartSchool.
QQQ Lags with Lower High
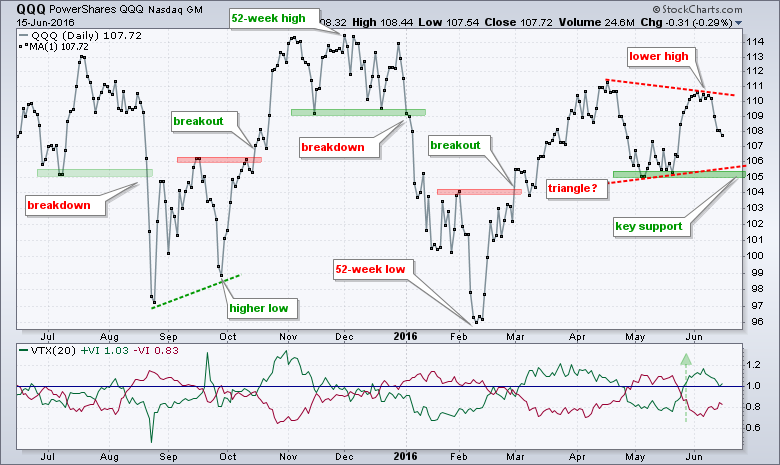
The QQQ chart is a clear mess with a trading range over the past year and four big swings within this range. The current swing remains up since the February breakout and QQQ could be forming a triangle consolidation. I am concerned with the lower high in early June because this shows relative weakness. Note that SPY and IWM forged higher highs in early June. The May lows mark key support in the 105 area and a break here would be bearish. The moment-of-truth will arrive when/if QQQ moves into the 106 area. There is support here and a bounce in this area would further confirm the triangle. The Vortex pair has been bullish since late May.
A Choppy Advance for IWM
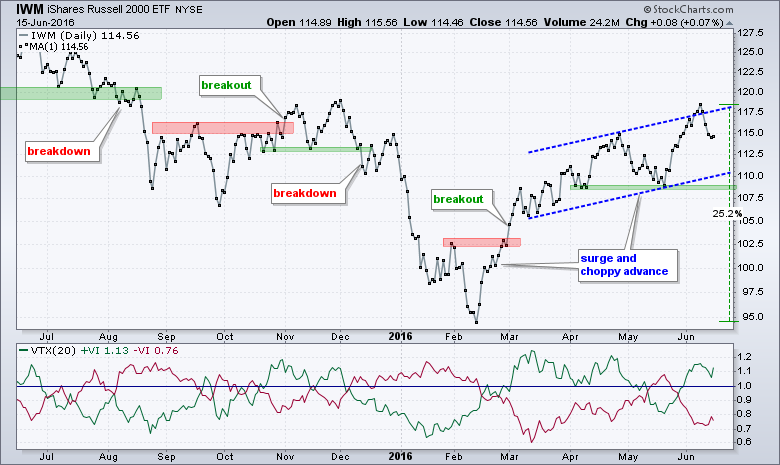
IWM surged some 25% from the February low to the June high and this advance can be divided into two parts. First, there is the initial surge. Second, there is a choppy advance since early March. The April-May lows mark key support in the 108-109 area. Technically, IWM could pullback to the 110-111 area and still be in an uptrend. The Vortex pair has been bullish since 31-May.
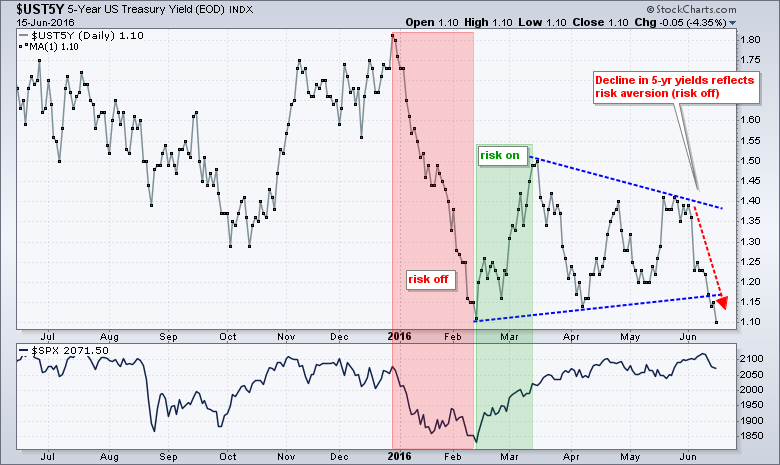
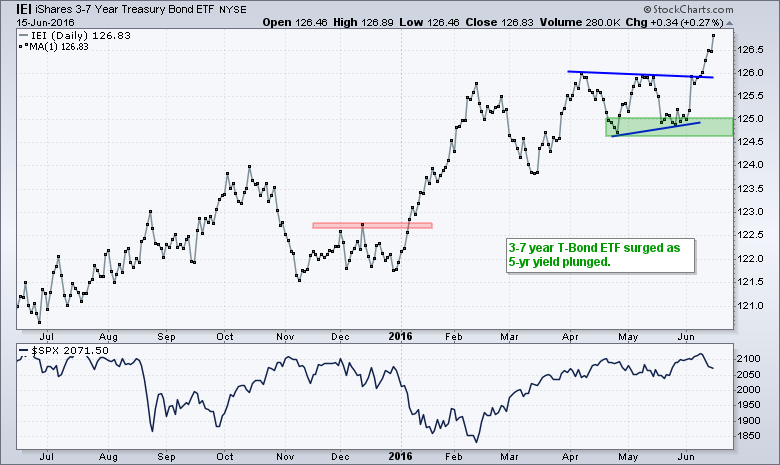
5-yr Yield hits 2016 Low
The surge in Treasury bonds and plunge in Treasury yields continues to rattle the markets. The 5-year Treasury Yield ($UST5Y) plunged in January as the market moved to risk-off and surged from mid February to mid March as the market moved to risk-on. The risk on-off shifts have been shorter since mid March, but it looks like a longer risk-off shift is taking shape as $UST5Y broke to new lows this week. The 5-yr yield is at the short end of the curve and leading Treasury yields lower. This, in turn, is triggering selling pressure in banking stocks and weighing on the finance sector.
Oil Falls within Rising Channel
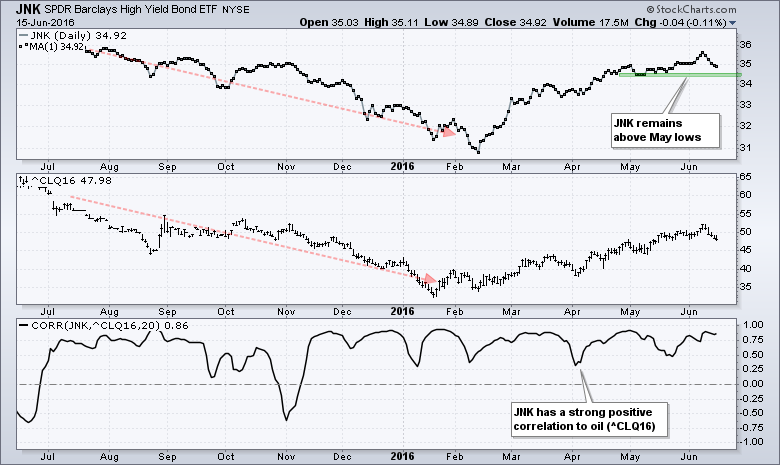
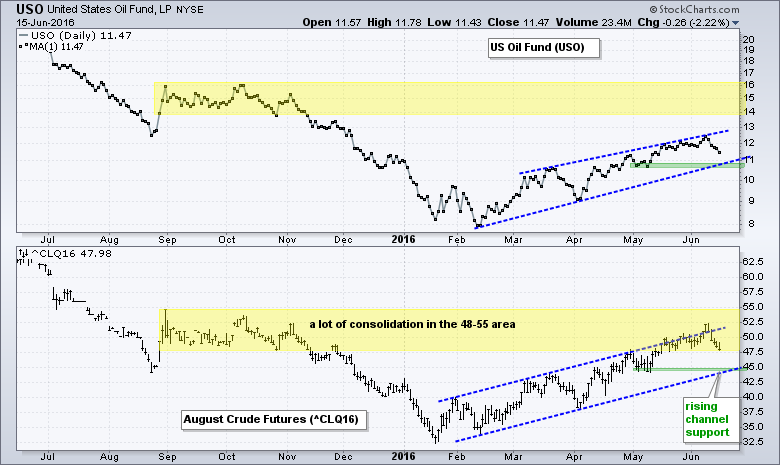
Oil is down over 7% the last five days, but still within the confines of a larger uptrend. The decline in oil led to weakness in junk bonds and this furthered the risk-off trade. Note that oil and the High Yield Bond SPDR (JNK) remain above their May lows and the recent declines have yet to reverse the bigger uptrend.
I am focused on August Crude (^CLQ16) for analysis and key levels (bottom window). The yellow area shows the consolidation from September to October and this area looks like a natural resistance zone. The blue trend lines mark a rising channel with support in the 44-45 area (May lows). Crude could fall another 5-6% and still be within this channel and still well above the January-February lows.
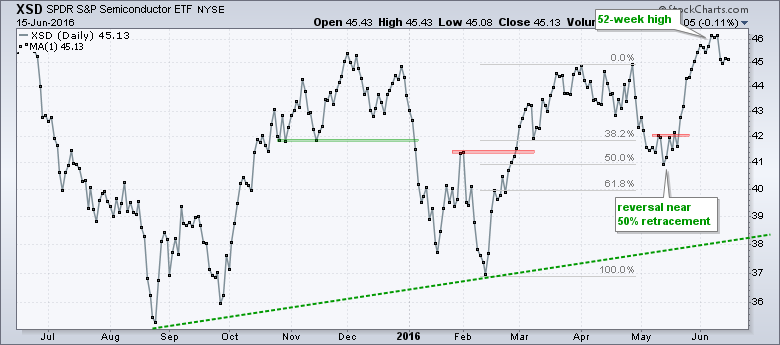
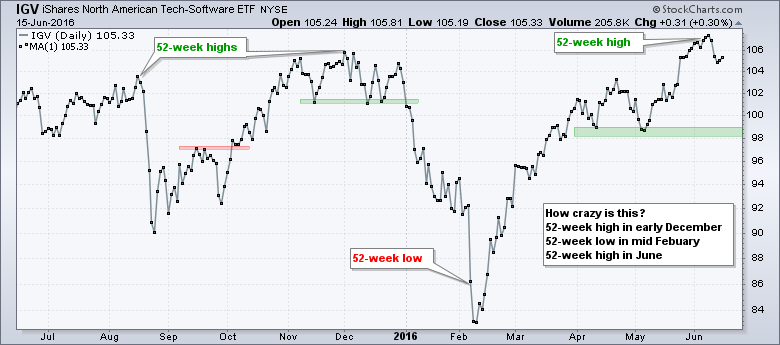
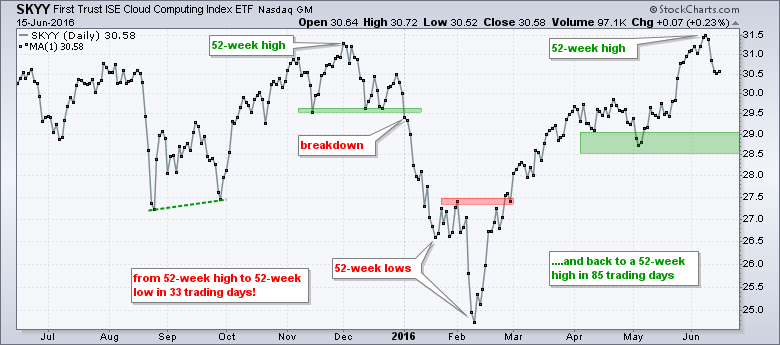
New High, New Low and Back Again
Just how crazy is this tech sector? The Semiconductor SPDR (XSD), Software iShares (IGV) and Cloud Computing ETF (SKYY) hit new 52-week highs last week and these three are leading. The latter two moved from 52-week lows to 52-week highs in about four months. Talk about a sharp about face. These new highs are bullish, but these three ETFs could pullback after big runs the since early May.
Large-cap Techs Weigh on XLK
A few large-caps within the tech sector are below their 50-day SMAs and weighing on the cap-weighted Technology SPDR (XLK). Notice that Alphabet (GOOGL), Microsoft (MSFT), Apple (AAPL) and Facebook (FB) are below their 50-day moving averages. XLK is right at its 50-day. I do not use the 50-day moving averages as a support level. Instead, I use them as benchmark levels to compare different stocks and ETFs. Those above show relative chart strength. Those below show relative chart weakness.
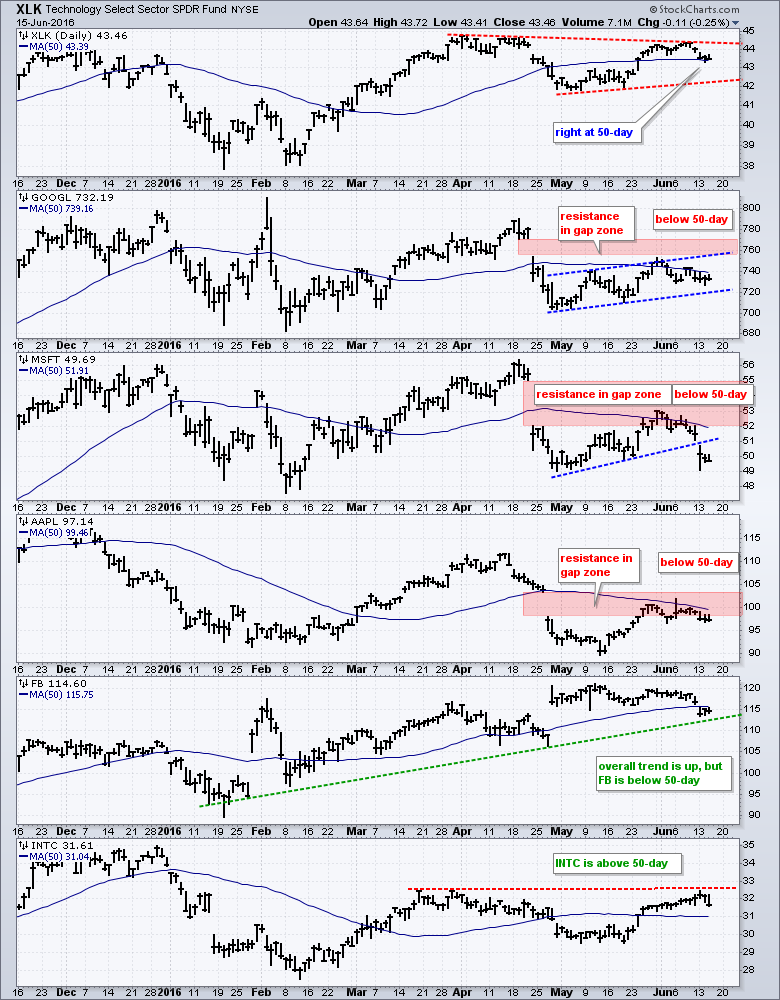
Within consumer discretionary, note that Home Depot (HD), Starbucks (SBUX), Nike (NKE) and Disney (DIS) are below their 50-day lines and showing relative weakness. Within the finance sector, note that Berkshire (BRK/B), Wells Fargo (WFC), Bank of America (BAC), Citigroup (C) and Goldman Sachs (GS) are below their 50-day lines and showing relative weakness. Overall, we have large-cap techs, consumer discretionary and finance weighing on the market. Despite these rather large pockets of weakness, my medium-term breadth indicators remain on bull signals. These were highlighted on Monday.
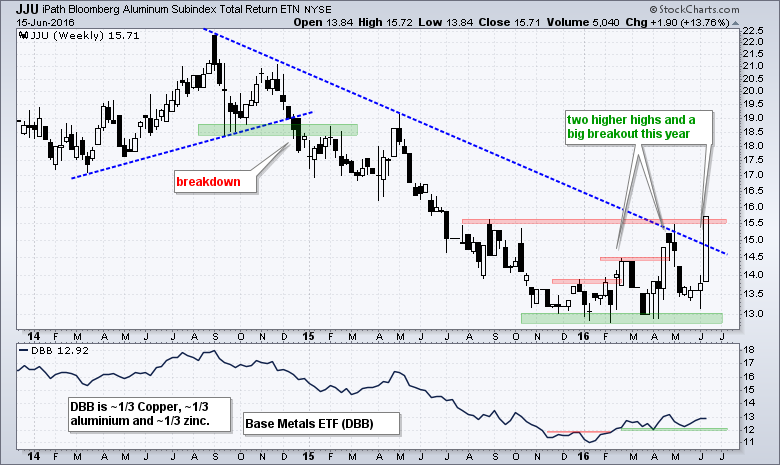
Aluminum Surges to High of the Year
I showed the Aluminum ETN (JJU) in Tuesday's webinar and it made a big wave on Wednesday. JJU is not ideal for trading or investing because it is thinly traded, but the ETF can still be valuable for analytical purposes. The price of aluminum should have some affect on aluminum stocks and it looks like JJU is making a breakout. Note that this is not the first breakout in 2016. This is the third breakout and the ETF is on the verge of a 52-week high.
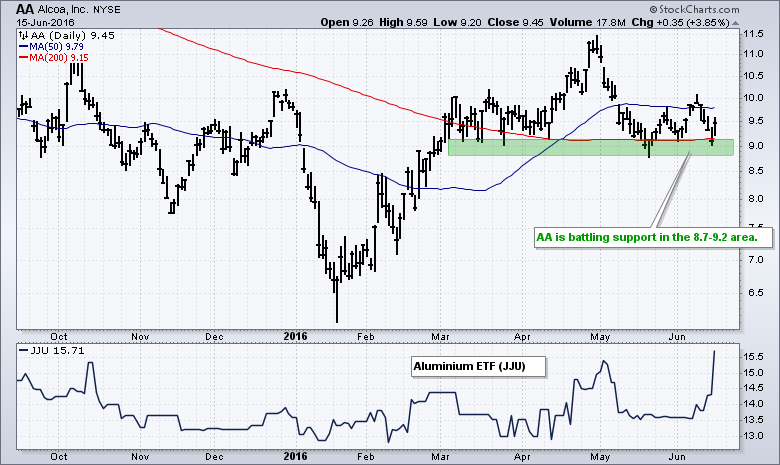
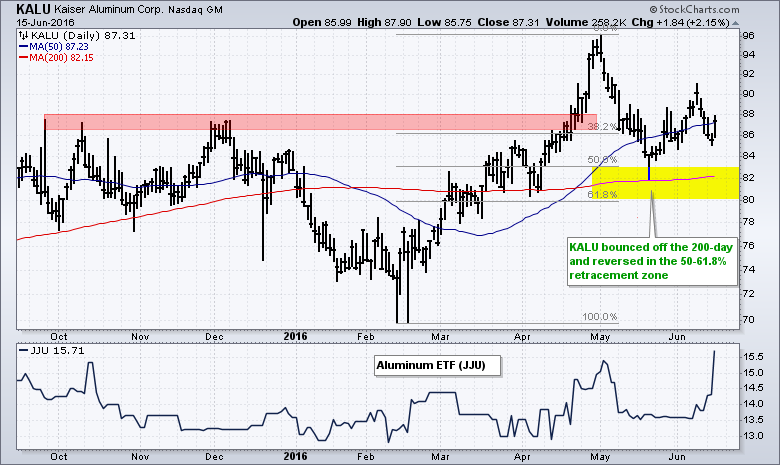
Alcoa and Kaiser Bounce along with Aluminum
Alcoa (AA) one of the biggest aluminum players in the market and its stock is battling support in the 9 area. Notice that the 200-day SMA is in this area and this moving average is starting to turn up.
Kaiser Aluminum (KALU) is even stronger than AA because it recorded a 52-week high earlier this year. The stock fell back in May, but reversed in the 50-61.8% retracement zone and ultimately held the rising 200-day SMA.
******************************************************
Measuring Risk On-Risk Off - Using charts to quantify stock, economic and credit risk.
PPO Trading Strategy - How to use 3 PPOs to develop a trend-reversion trading strategy.
Long-term Trend Indicators - Using the PPO, EMA Slope and CCI to determine the trend.
ETF Master ChartPack - 300+ ETFs organized in a Master ChartList and in individual groups.
Follow me on Twitter @arthurhill - Keep up with my 140 character commentaries.
****************************************
Thanks for tuning in and have a good day!
--Arthur Hill CMT
Plan your Trade and Trade your Plan
*****************************************


