Waning Momentum is Not Always Negative // Selling Pressure Remains Muted // IWM Breaks Out of Flag // Here Comes August // Positive Correlation between Bonds and Gold // Adding Parabolic SAR to IEF Signal // Gold Follows Through on Bullish Signal // Scanning the S&P 1500 for RSI-StochRSI Signals // Scan Code //// .....
Waning Momentum is Not Always Negative
There is no change for the major index ETFs because the bulls are keeping up the pressure. Let's start with QQQ today. Notice how the ETF surged around 9% from 27-June to 12-July and then around 3% from 13-July to 27-July. Both moves extended for ten trading days, but the percentage difference is much less. This means upside momentum is slowing, but it does not means that downside momentum is taking over. It is perfectly natural for upside momentum to slow because a 9% advance in 10 days is clearly unsustainable. A 3% advance in 10 days is still quite impressive and more sustainable, but even this slower advance may need a chance to correct.
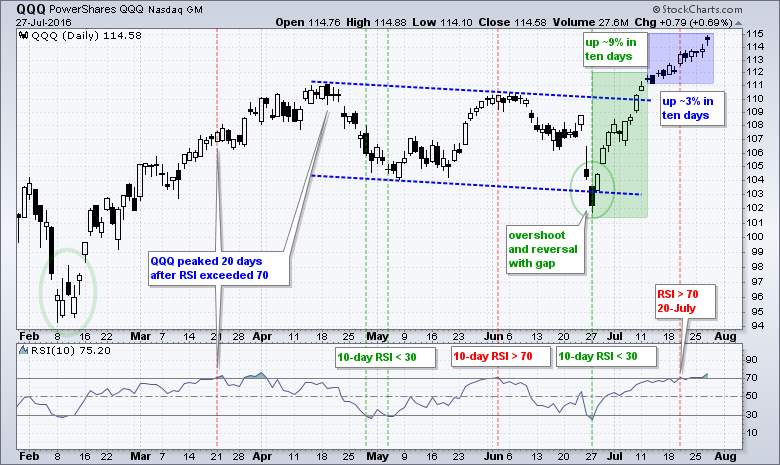
As noted before, 10-day RSI moved above 70 on 21-March and the ETF did not peak until 18-Apr, which was 20 trading days later. Again, upside momentum slowed as the advance labored higher. RSI moved above 70 on 20-July and this means we could have another one to three weeks to grind higher. I am really not sure where to mark short-term support and will just leave it off the chart for now.
Selling Pressure Remains Muted
While the major index ETFs do indeed seem extended and ripe for a pullback, I have yet to see any type of signal to suggest the pullback is starting. A downturn in a momentum oscillator does not count because momentum indicators gravitate towards their centerlines during a consolidation. For example, RSI moves towards 50 and MACD moves towards 0 when trading is flat.
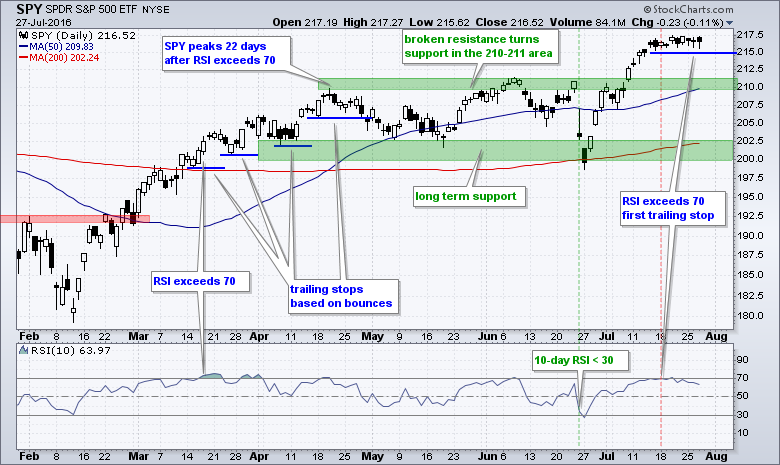
The SPY chart above shows the ETF holding above the 215 level because selling pressure has yet to increase significantly. Note that RSI exceeded 70 on 17-March and SPY did not peak until 20-April (22 days later). Most recently, RSI moved above 70 on 18-July and prices remain above their first support level.
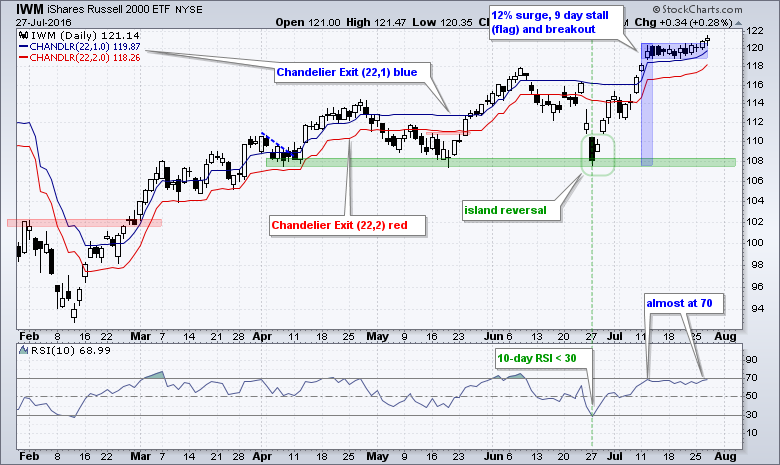
IWM Breaks Out of Flag
IWM surged around 12%, stalled for nine days and moved above its consolidation highs. The blue shading marks a classic high and tight flag, and the breakout on Tuesday signals a continuation. The blue line shows the Chandelier Exit (22,1) and the red line shows the Chandelier Exit (22,2). Both turned up because IWM moved to a new high. These trailing stops will continue higher as long as IWM advances.
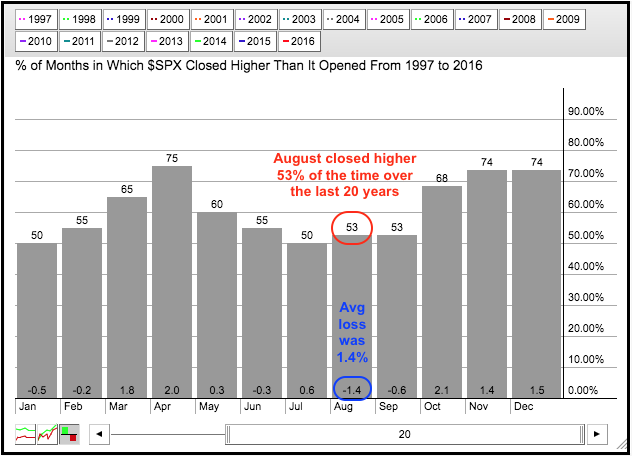
Here Comes August
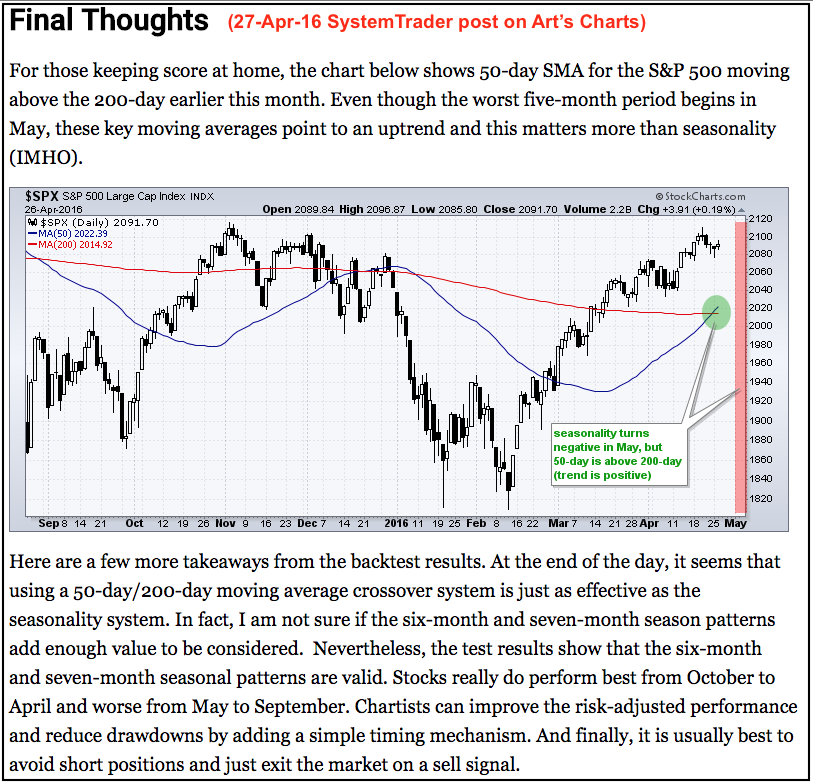
I don't use seasonality charts very much because I think everything we need to know can be found on the price chart. Seasonal patterns can also lead us astray. Remember the start of the bearish six month cycle in May? The S&P 500 did indeed dip in the first half of May, but the 50-day SMA remained above its 200-day SMA and index went on to new highs. Trend is greater than seasonal pattern. In fact, I tested this season pattern in a System Trader blog post. The "Final Thoughts" section noted that golden cross was more important than the seasonal pattern. The excerpt is below:
I am bringing up the seasonal pattern because stocks are quite extended and an August correction would be quite normal. The seasonal patterns are also turning more negative. The chart below shows the seasonal patterns for the S&P 500 over the last twenty years. August has closed higher just 53% of the time and the average gain/loss over the last twenty years is actually a loss (-1.4%). In fact, August is one of four months with an average loss and this loss is the largest. I don't think the market is in danger of moving from a bullish environment to a bearish environment, but I would be a little more careful as the odds of correction increase and August hits.
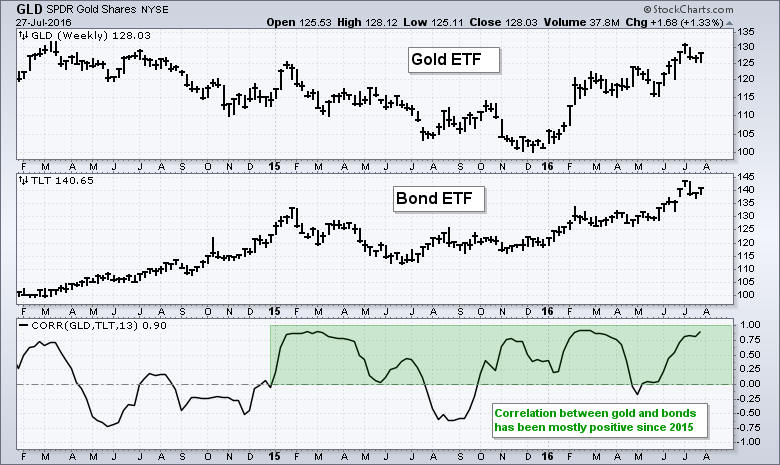
Positive Correlation between Bonds and Gold
It is weird to see bonds and gold on the same page, but this is the situation right now and since 2015. The chart below shows the Gold SPDR (GLD), the 20+ YR T-Bond ETF (TLT) and the Correlation Coefficient (GLD,TLT). This indicator has been mostly positive since 2015, which means gold and bonds have been moving in the same direction. It is an unusual relationship, but I am not going to speculate on why. My preference is to look at bond charts to analyze bonds and gold charts to analyze gold. Relationships are interesting, but they can distract from what is actually happening on the price charts (kind of like seasonality).
Adding Parabolic SAR to IEF Signal
The 7-10 YR T-Bond ETF (IEF) popped with a break above short-term resistance on Wednesday (red line). Notice that an RSI-StochRSI setup-signal triggered just before this breakout. The setup occurs when the bigger trend is up and 5-day RSI dips below 30 (pullback within an uptrend). The trigger is when 5-day StochRSI surges above .80 or to 1 (trader's choice).
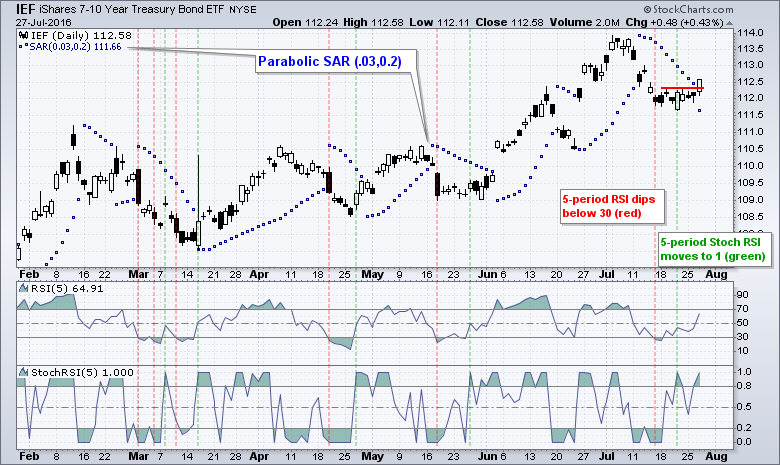
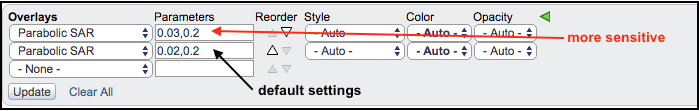
Chartists cannot add a Chandelier Exit just yet because the current price is below Chandelier Exit (22,3). Instead, chartists can consider the Parabolic SAR, which was developed by the legendary Welles Wilder. The formula is way to complicated to explain here so you will need to consult the ChartSchool article for details. Parabolic SAR acts as a trailing stop and chartists can change the parameters to increase or decrease sensitivity. The default setting is (.02,0.2) and increased sensitivity by increasing the Acceleration Factor from .02 to .03 in the parameters box. This puts the current stop at 111.66 (blue dot under current candlestick).
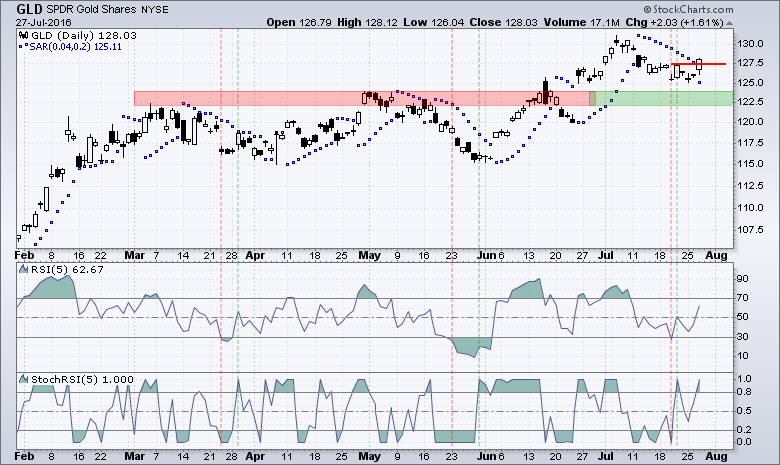
Gold Follows Through on Bullish Signal
The Gold SPDR (GLD) sports a similar setup with RSI moving below 30 on 20-July and StochRSI surging to 1 on 21-July. The ETF broke above first resistance with yesterday's pop and Parabolic SAR (.04,.2) sets the first stop at 125.11. Notice that I had to increase sensitivity even more to get the stop under current prices.
Scanning the S&P 1500 for RSI-StochRSI Signals
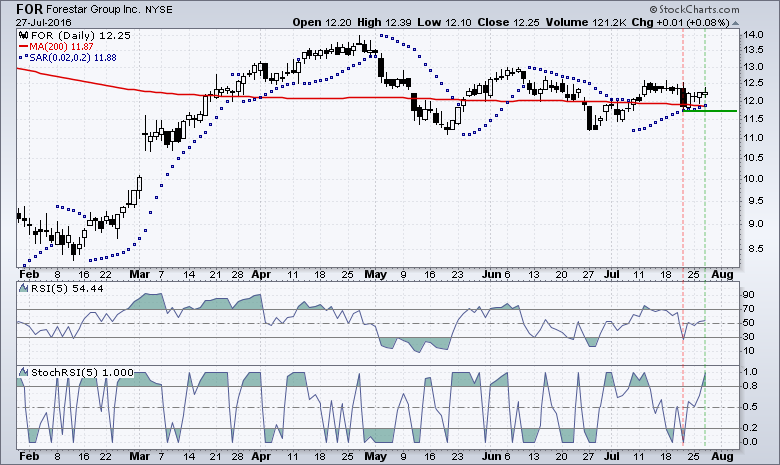
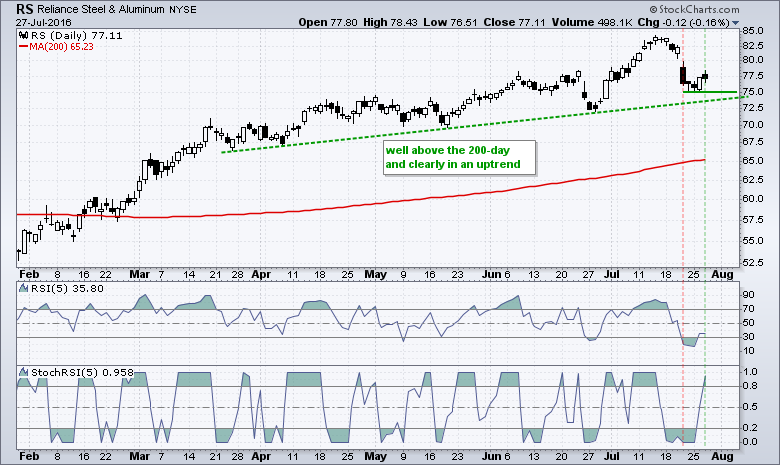
I scanned the S&P 1500 for RSI-StochRSI setups and came across two interesting charts. There were over a dozen setups, but I threw out stocks that report earnings within the next 1-2 weeks. Before looking at these setups, please keep in mind that you and only you are responsible for your trading decisions.
The first chart shows Forestar Group (FOR) just above its 200-day SMA as StochRSI popped above .80 on Wednesday. Parabolic SAR marks a potential stop at 11.88 and last week's low market a potential stop 11.78. Actuals stops are usually placed just under these levels. Please don't ask if I prefer intraday prices or closing prices. This is your choice!
The second chart shows Reliant Steel (RS) within a clear uptrend overall and well above the 200-day moving average. The stock pulled back sharply last week and 5-day RSI moved below 30. With the setup in place, StochRSI popped above .80 to trigger a bullish signal on Wednesday's close. Chartists can mark first support at 75.
Scan Code
Here is the scan code in case you are interested.
[group is SP500] or [group is SP400] or [group is SP600]
and [SMA(200,volume) > 100000] // average volume > 100kAND [SMA(5,Close) > SMA(200,Close)] // 5-day SMA is above 200-day
AND [Min(10,RSI(5)) < 30] // 5-day RSI below 30 over last 10 days
AND [Stoch RSI(5) x .80] // 5-day StochRSI crossed above .80
******************************************************
Measuring Risk On-Risk Off - Using charts to quantify stock, economic and credit risk.
PPO Trading Strategy - How to use 3 PPOs to develop a trend-reversion trading strategy.
Long-term Trend Indicators - Using the PPO, EMA Slope and CCI to determine the trend.
ETF Master ChartPack - 300+ ETFs organized in a Master ChartList and in individual groups.
Follow me on Twitter @arthurhill - Keep up with my 140 character commentaries.
****************************************
Thanks for tuning in and have a good day!
--Arthur Hill CMT
Plan your Trade and Trade your Plan
*****************************************


