SPY Stalls and Gains Hold // Marking First Support for QQQ // IWM Forms High and Tight Flag // Energy Sector Nears Make-or-break Level // XES Breaks Channel Trend Line // Oil Resumes Long-term Downtrend // Webinar Preview //// .....
SPY Stalls and Gains Hold
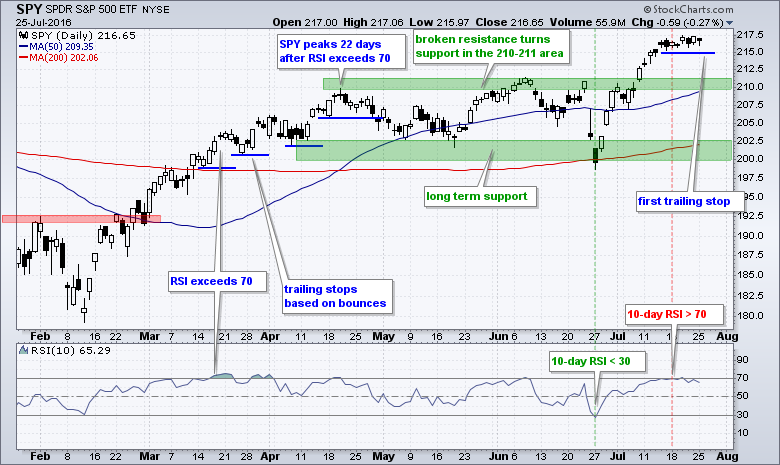
There is no real change in SPY, QQQ and IWM over the past week. SPY surged around 9% and then stalled the last seven days with a tight consolidation. Notice how the ETF traded between 215 and 217.5 for over a week. This tight range just tells us that buying and selling pressure have equalized. It may foreshadow a short-term top and it may not. The bigger trend is clearly up and this means short-term pullbacks are not playable (in my humble opinion). A break below first support at 215 would argue for some sort of correction, but I think the next playable setup will emerge when/if SPY becomes short-term oversold. Notice that broken resistance in the 210-211 area becomes the first support level to watch on a pullback.
Marking first Support for QQQ
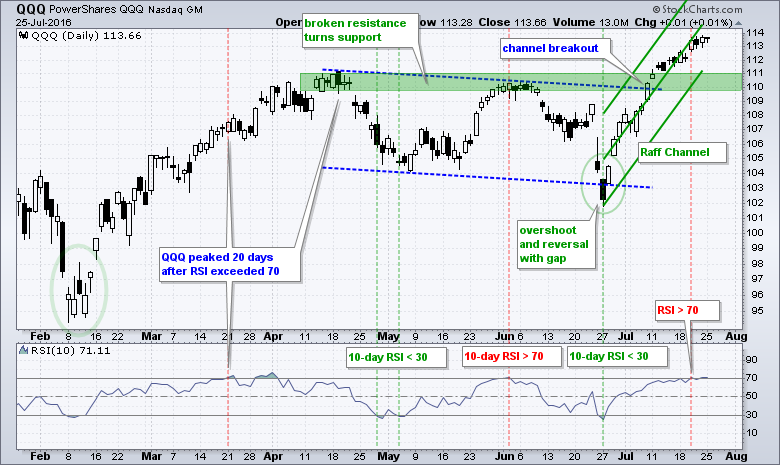
Marking support for an index or ETF with dozens of moving parts is sometimes an exercise in futility. SPY has 500 moving parts (stocks), QQQ has 100 stocks and IWM has 2000 stocks. Each stock has its own support and resistance levels, and these don't always jibe with the underlying ETF. In any case, we make educated guesses on where support may materialize. QQQ broke the channel trend line and its prior highs in July and the broken resistance zone becomes the first support guess in the 110-111 area. The Raff Regression Channel, which is also an educated guess, defines the uptrend with support around 111. I imagine that QQQ would become short-term oversold with a move into the 110-111 area and such a pullback would provide the next trading setup. I am not even thinking about short positions because the bigger trend is clearly up.
IWM Forms High and Tight Flag
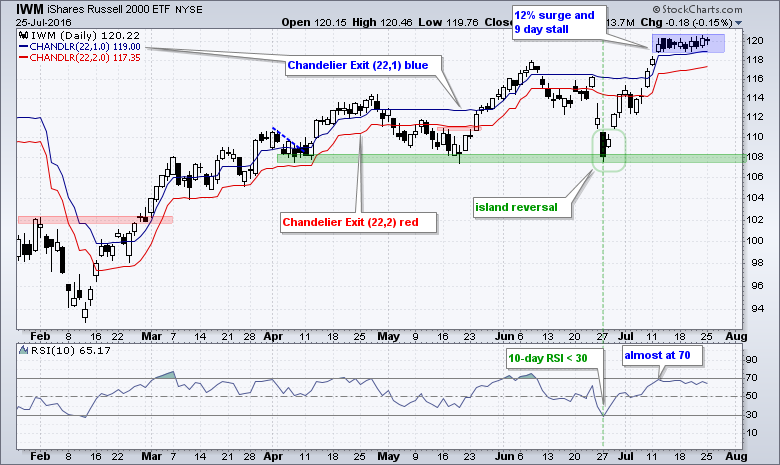
IWM surged around 12% and then stalled with a tight range around 120. This could be a high and tight flag, and a breakout would signal a continuation higher. The blue line is a Chandelier Exit (22,1) and the red line is a Chandelier Exit (22,2). Both are based on ATR(22). The first is set 1 ATR value below the 22 day high and the other is set 2 ATR values below the 22-day high. This means the stop-loss (exit) rises as the ETF forges new highs. The blue stop-loss is quite tight at 119 and the red stop-loss is at 117.35. Note that a move below 118.9 would break the consolidation lows and could also be used as a stop.
Energy Sector Nears Make-or-break Level
The majority of sectors are in bull mode and this supports the overall uptrend in stocks. Of the nine sectors, I am noticing some weakness in energy and one breadth indicator is close to a bearish signal. This puts XLE at a make-or-break level. The chart below shows the Energy SPDR (XLE), the EW Energy ETF (RYE) and three breadth indicators. The 10-day EMA of XLE AD Percent ($XLEADP) is the lowest of the nine sectors and close to exceeding -30%, which would trigger a bearish signal. This is usually the first of the breadth indicators to signal.
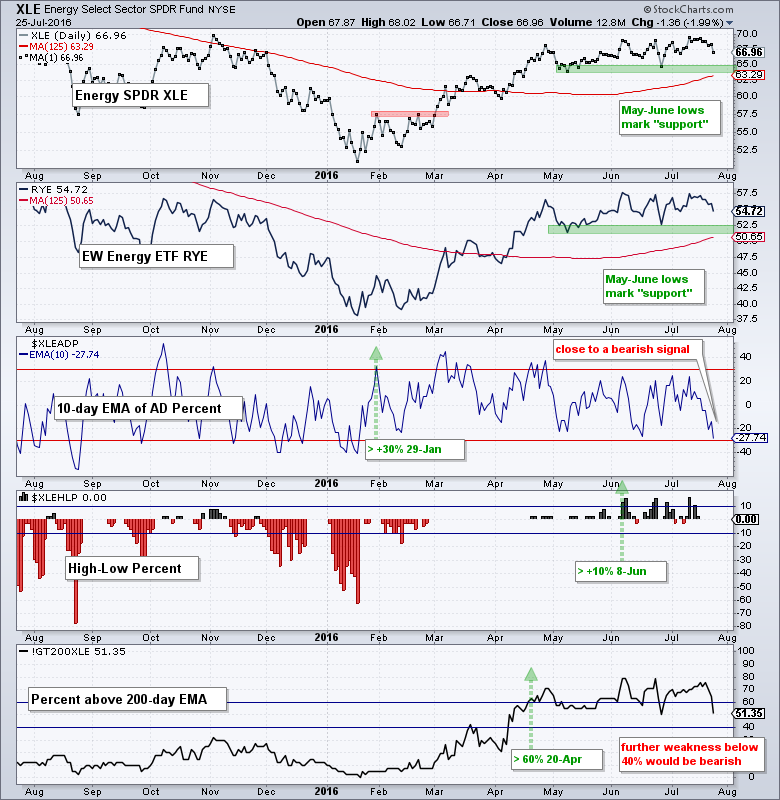
Energy High-Low% ($XLEHLP) and Energy %Above 200-day EMA (!GT200XLE) are also at their lowest values for the nine sectors. This means that breadth for XLE is clearly the weakest of the nine sectors. A move below 40% in Energy %Above 200-day EMA would trigger a bearish signal. I will review the other eight sectors and their breadth indicators in today's webinar.
XES Breaks Channel Trend Line
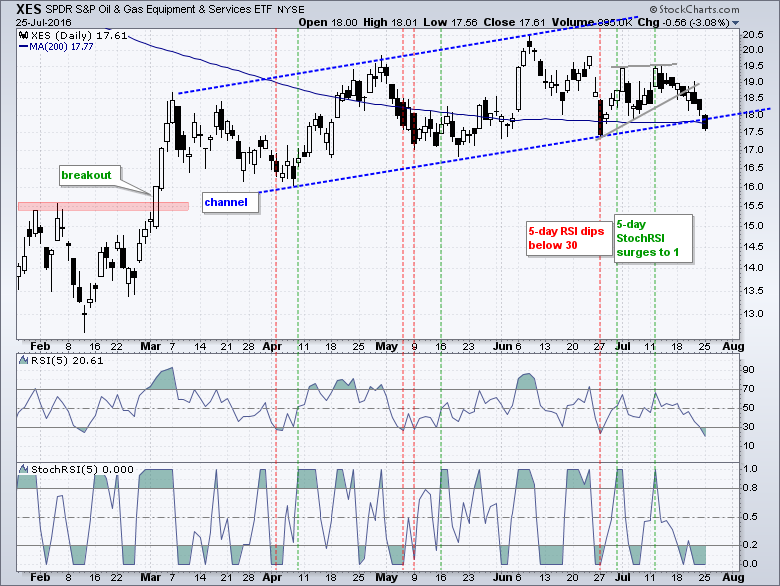
The Oil & Gas Equip & Services SPDR (XES) could also be at a make-or-break level for the bigger trend as the ETF led the energy sector lower with a channel break on Monday. I featured the RSI-StochRSI bullish signals last week and they have clearly failed. RSI moved below 30 in late June and StochRSI surged to 1 twice for bullish signals. RSI is now back below 30 and XES closed below the falling 200-day SMA. This is similar to the situation the ETF found itself on June 27th (red line). As with XLE above, it appears that XES is at a make-or-break level. Note that the ETF is down around 6% the last four weeks and SPY is up around 6.5% over this same timeframe. That is some serious relative weakness.
Oil Resumes Long-term Downtrend
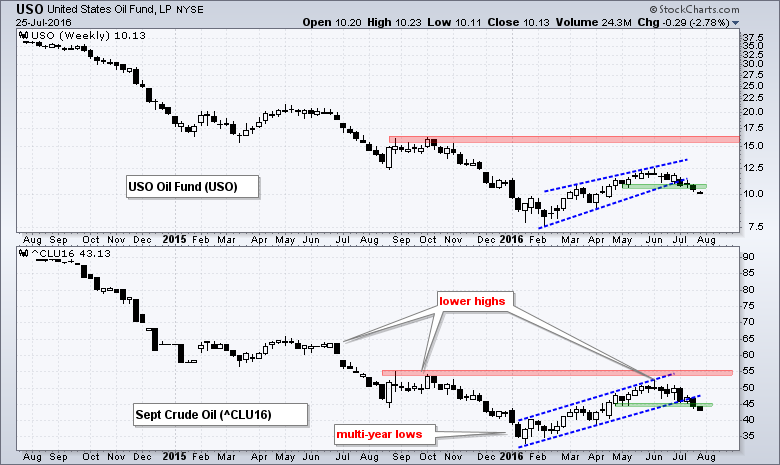
The future of XLE and XES could hinge on oil and the long-term picture for crude does not look good after a channel break the last two weeks. The chart below shows the USO Oil Fund (USO) in the top window and September Crude (^CLU16) in the lower window. Sept Crude hit a multi-year low in January and then embarked on a five month advance that gained around 50%. It is a huge advance in percentage terms, but still looks like a bear market rally overall. Notice that oil did not exceed its prior highs and another lower high is taking shape. I was prepared to give the bulls the benefit of the doubt as long as the channel held. Now that it is broken, it looks like the bigger downtrend is taking over and a test of the January lows could be in order.
Webinar Preview
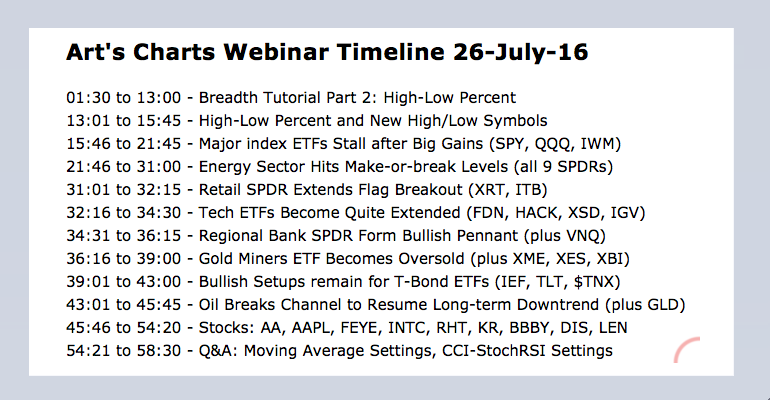
I will cover the charts above as well as the following in today's webinar (Tuesday, July 26th, 1PM ET).
- Part 2 on Breadth Indicators: High-Low Percent
- Sector SPDR Chart Overview
- Key industry Group ETFs
- Short-term Setup in 20+ YR T-Bond ETF
- Stocks: AA, AAPL, DIS, DSW, GE, INTC, KR, LEN
******************************************************
Measuring Risk On-Risk Off - Using charts to quantify stock, economic and credit risk.
PPO Trading Strategy - How to use 3 PPOs to develop a trend-reversion trading strategy.
Long-term Trend Indicators - Using the PPO, EMA Slope and CCI to determine the trend.
ETF Master ChartPack - 300+ ETFs organized in a Master ChartList and in individual groups.
Follow me on Twitter @arthurhill - Keep up with my 140 character commentaries.
****************************************
Thanks for tuning in and have a good day!
--Arthur Hill CMT
Plan your Trade and Trade your Plan
*****************************************


