Breadth Indicator Review // New Highs Soften in late July // %Above 200-day Remains Strong // Marking First Support for S&P 500 // Dealing with the Spike in QQQ // SPY Extends Trading Range //// .....
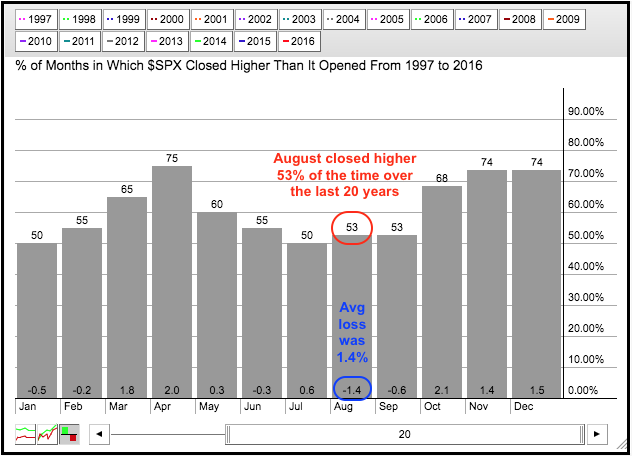
The stock market environment remains bullish, but the major index ETFs are extended after big gains the last five weeks. In addition to being ripe for a corrective period, August is here and this has been a weak month on the seasonal charts. SPY is up over 9% the last five weeks and a pullback or corrective period would be perfectly normal at this stage. Programming Note: There was no webinar on 2-Aug because of techinique difficulties.
Breadth Indicator Review
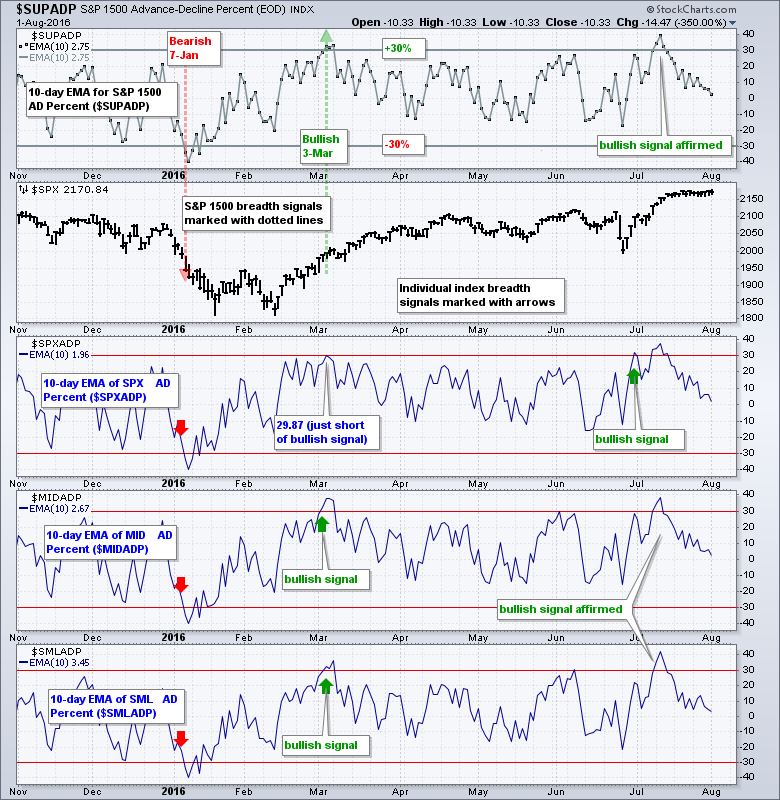
I will start with a review of the three key breadth indicators for the broad market. I explained the 10-day EMA of AD Percent and High-Low Percent in the last two webinars, and I will cover the Percentage of Stocks above the 200-day EMA in today's webinar. The 10-day EMA of S&P 1500 AD Percent ($SUPADP) surged above +30% to turn bullish on March 3rd and moved above +30% again in early July. The first signal marks a surge in upside participation (advances) that signals a breadth thrust and the second move just affirms the existing bullish signal. Overall, this indicator remains bullish until there is a bearish signal with a move below -30%. The 10-day EMA is currently near zero and nowhere close to a bearish signal. A move below -30% would suggest a strong surge in downside participation (declines).
New Highs Soften in late July
S&P 1500 High-Low Percent ($SUPHLP) turned bullish with a move above +10% on March 30th. This signal was made possible because S&P 500 HiLo% ($SPXHLP) and S&P 400 HiLo% ($MIDHLP) both surged above +10%. These signals show broadening participation and this supports a bull market environment. Small-caps lagged as S&P 600 HiLo% ($SMLHLP) did not exceed +10% until early June. Short-term, I am noticing fewer new highs from early July to late July and this suggests some softening in the indicator. Nevertheless, High-Low Percent remains positive overall and we have yet to see a significant increase in new lows.
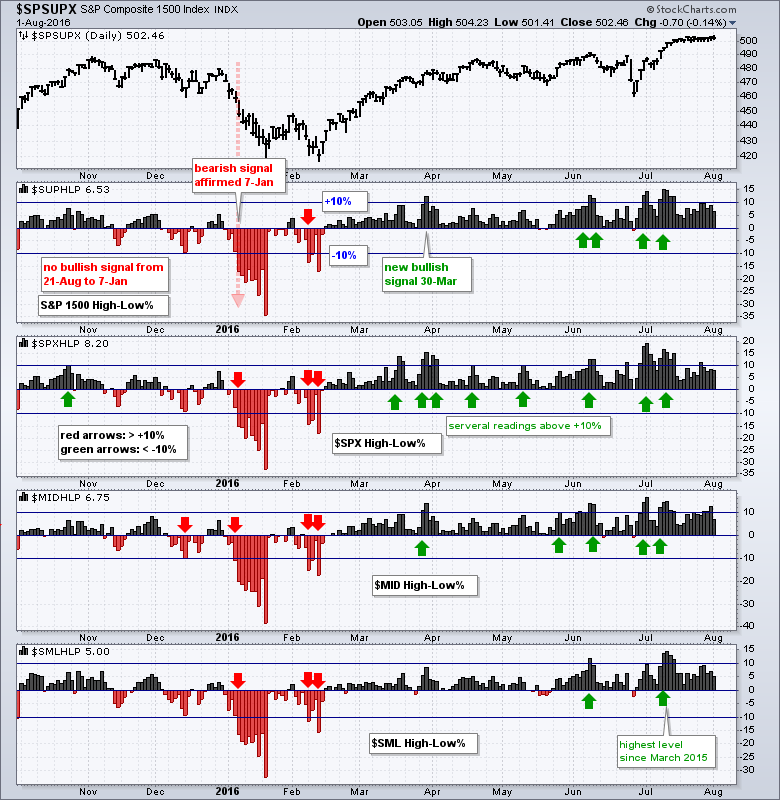
The Percentage of Stocks above the 200-day EMA is available for the S&P 500, S&P MidCap 400 and S&P Small-Cap 600. A bullish signal triggers when two of the three move above +60% and a bearish signal triggers when two of the three move below 40%. Chartists can use the raw indicators for more sensitivity or smooth them with a 10-day EMA (red lines). The raw indicators turned net bullish on March 18th, which was when the S&P 500 and S&P MidCap 400 moved above +60%. All three held above +40% in late June and are currently at 70% or higher (rounded).

Marking First Support for S&P 500
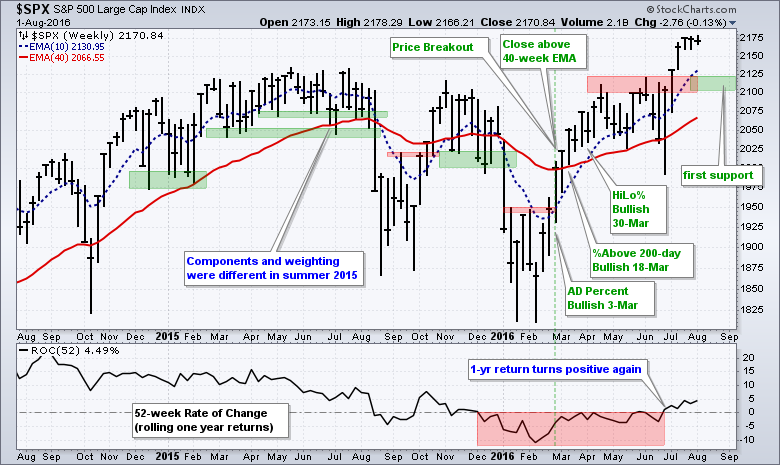
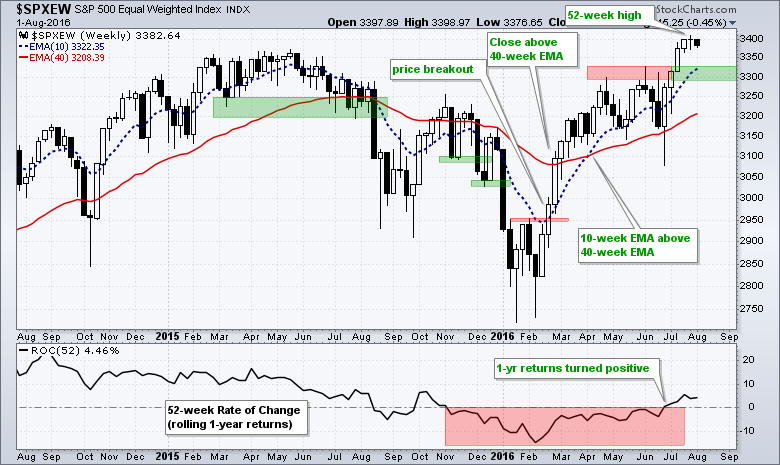
Now let's combine the bullish breadth signals with the chart action for the S&P 500. The bullish signals started in early March when the index broke resistance, closed above its 40-week EMA and AD Percent triggered a bullish signal. Note that the 40-week EMA is similar to, but not exactly the same as, the 200-day EMA. The initial bullish signals were followed by bullish signals from the Percent of Stocks Above 200-day EMA, High-Low Percent and the 10-week EMA crossing above the 40-week EMA. All indicators were aligned with the bulls by the end of March and this means the subsequent move to new highs should not have come as a surprise. In addition, one should expect resistance to be broken in an uptrend and this is why I do not mark resistance when the trend is up. I realize that there was some resistance in the 2100-2125 area from the April-June highs and the index exceeded this level with the recent surge. The broken resistance zone around 2100-2120 turns first support to watch on a pullback.
The chart for the S&P 500 Equal-Weight Index ($SPXEW) shows an array of bullish developments beginning with the price breakout and close above the 40-week EMA in late February.
Dealing with the Spike in QQQ
QQQ extended higher the last three weeks, but there was an errant spike to 118.78 on Monday. This is not a StockCharts error because this spike appears on other websites and data feeds, including the Wall Street Journal. Even though I view this as an errant spike, it is part of the official data feed and we must deal with it. I do not consider this a shooting star because I do not see the spike on the intraday charts and I assume it is a rogue trade. Thus, nothing has changed on the chart. QQQ surged 9% in ten days and is now up 4% the last three weeks. The advance is slowing, but clearly not stopping and the bulls remain in control of the short-term trend. I drew a short trend line to define the three week advance and a move below 114 would break this trend line.
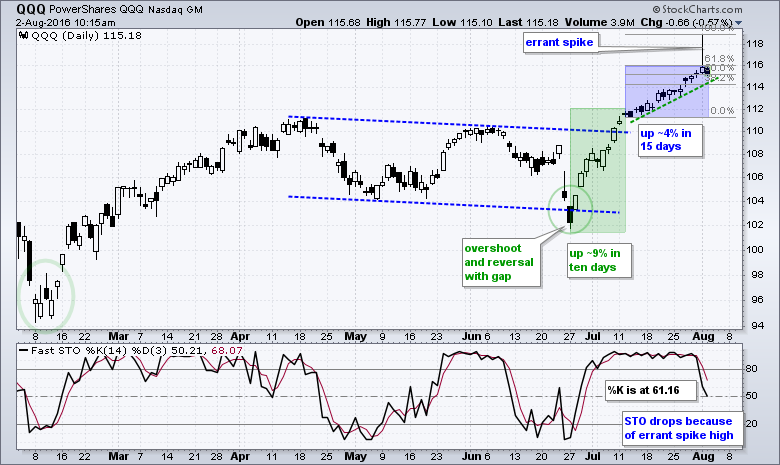
I am showing the 14-day Fast Stochastic Oscillator to illustrate the challenge with indicators that use the intraday high and low. The Stochastic Oscillator and CCI use the close along with intraday highs and lows, while RSI and MACD use closing prices only. The Stochastic Oscillator is based on the 14-day high-low range, which is marked with the gray Fibonacci Retracements Tool on the price chart. The Stochastic Oscillator measures the level of the close relative to this high-low range. Notice that QQQ closed near the 61.8% retracement, which means it is just above the midpoint of the range. The Stochastic Oscillator is at 61.16, which is also just above the mid point of its range. The Stochastic Oscillator fell sharply on Monday because the close is well below the high-low range. This, of course, is because of the spike high.
SPY Extends Trading Range
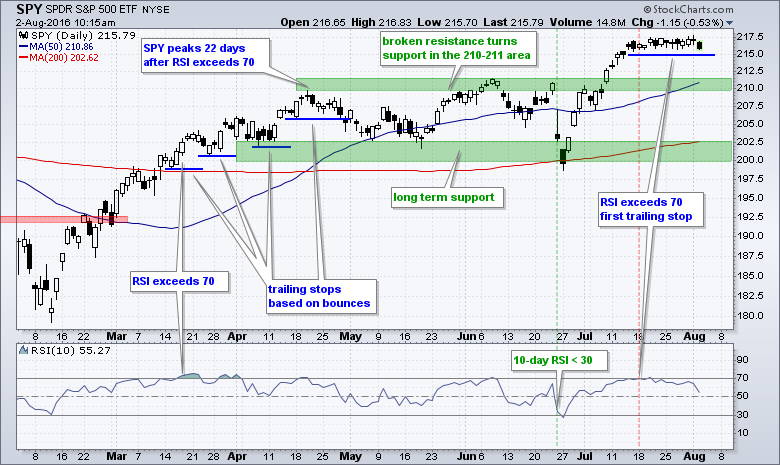
SPY extended its trading range and remains above first support at 215, which acts as a trailing stop. For reference, the blue lines mark trailing stops based on short-term troughs in March and April. While a break below 215 would be negative, I would not consider it bearish because the bigger trend is up and this means pullbacks are opportunities, not threats. Broken resistance turns into the first support zone around 210-211. The April-July lows and rising 200-day moving average mark long-term support in the 200-202 area.
IWM remains in the performance middle. It is not a strong as QQQ over the last three weeks, but it is a little stronger than SPY. The ETF edged above flag resistance five days ago and remains just above this level on a closing basis. The Chandelier Exit (22,3) in red and the flag lows mark first support in the 118.5-118.65 area. A close below 118.5 would break flag support and negate the bullish setup.

******************************************************
Measuring Risk On-Risk Off - Using charts to quantify stock, economic and credit risk.
PPO Trading Strategy - How to use 3 PPOs to develop a trend-reversion trading strategy.
Long-term Trend Indicators - Using the PPO, EMA Slope and CCI to determine the trend.
ETF Master ChartPack - 300+ ETFs organized in a Master ChartList and in individual groups.
Follow me on Twitter @arthurhill - Keep up with my 140 character commentaries.
****************************************
Thanks for tuning in and have a good day!
--Arthur Hill CMT
Plan your Trade and Trade your Plan
*****************************************


