SPY Looks More Bullish than Bearish // QQQ and IWM Hold the Gaps // Measuring the Sector Balance in the S&P 500 // All Nine Sector SPDRs have Golden Crosses Working // Healthcare SPDR Clears Benchmark High // Overbought, Oversold and the Bigger Trend // Amazon and Home Depot Power MarketVectors Retail ETF // Retail SPDR Perks Up // Stocks to Watch: GD, UTX, INTC, ATHN //// .....
There are more bullish indications than bearish indications on the SPY chart. First, the 50-day SMA is above the 200-day SMA. Second, price is above the 200-day SMA and this moving average is rising. Third, support in the 200-203 area ultimately held, as did the 200-day. Note that the break below the 200-day and close below 200 occurred with an overreaction to the Brexit vote. I will keep key support in the 200-203 area and remain bullish as long as this support zone holds.
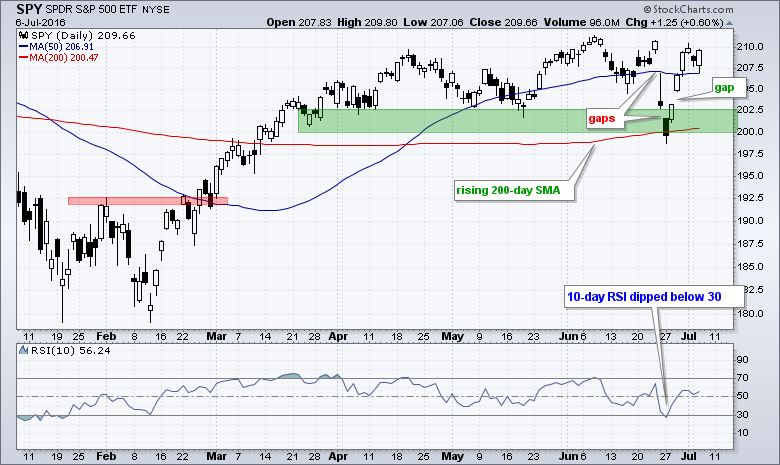
Short-term, the ETF gapped down twice after Brexit and then gapped up on 29-June. The surge off the support zone and this last gap are short-term bullish. There was a lot of power behind this move and I see no reason to question bullish resolve as long as the 29-June gap holds. Overall, you can see that SPY has been largely range bound since mid April. This just means buying and selling pressure have equalized the last few months. Selling pressure is not dominant in a trading range. Moreover, a consolidation after the surge from mid February to mid April (+16%) is perfectly normal.
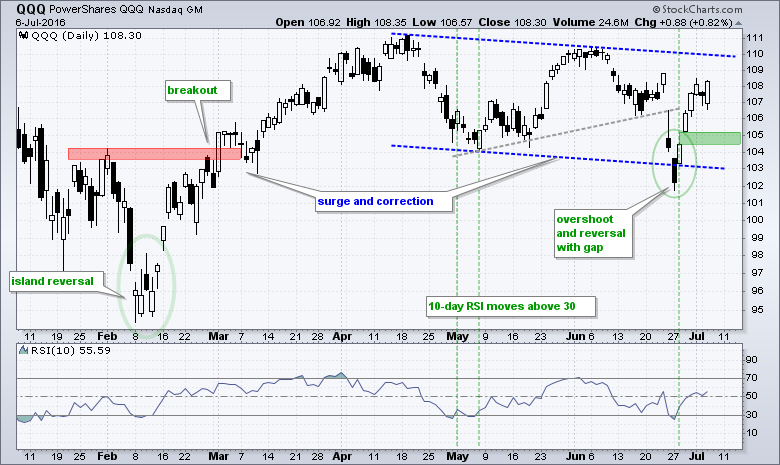
QQQ and IWM Hold the Gaps
QQQ shows a big surge from mid February to mid April and then a falling channel correction. This channel was actually a triangle (gray trend line) before the Brexit shenanigans. In any case, QQQ did not waste any time getting back on track as it surged back above the pre-Brexit lows (106). At the very least, the late June reversal and gap are short-term bullish until proven otherwise. A close below 104.4 would fill the gap.
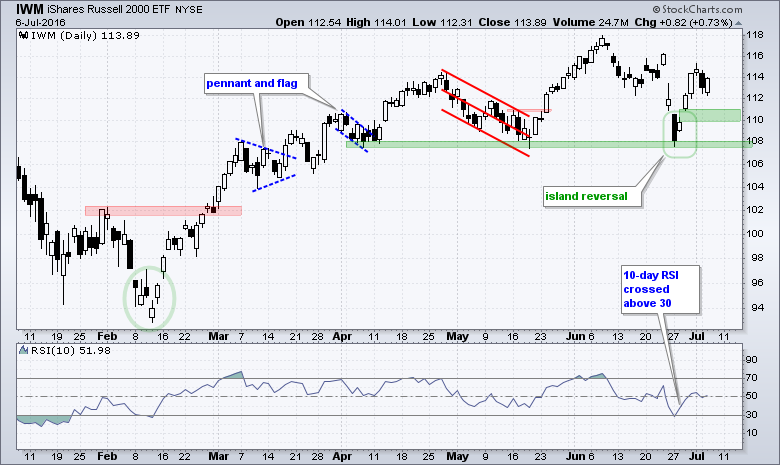
IWM was the only one of the big three to hold the mid May low, but the surge off support has been diminished by relative weakness in the finance sector. Note that the financial services sector accounts for 25.48% of IWM. REITs and Insurance are performing well, but banks and brokers are not. Short-term, IWM formed an island reversal in late June and this reversal is holding. A close below 109.7 would fill the 29-June gap.
Measuring the Sector Balance in the S&P 500
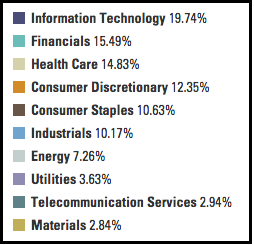
An index or ETF will move higher if the majority of its components are moving higher. We can break down the S&P 500 by looking at breadth indicators, the sector weightings and the top 20 stocks. I have already written about bullish breadth and I will expand on the sector weightings today. The image below comes from SPDRs.com and it shows the weighting for 10 sectors. Note that most of the telecom stocks are part of the Technology SPDR (XLK). The S&P 500 can move higher when the bullish sectors total more than 50%.
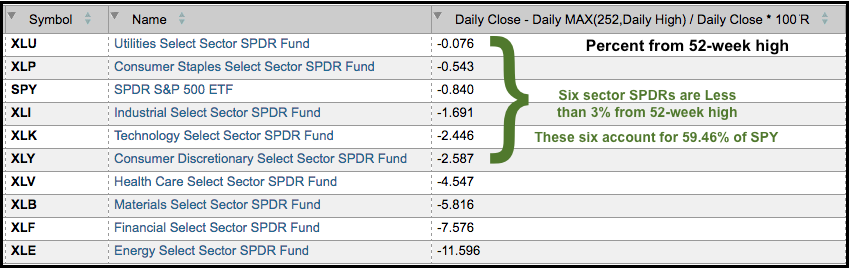
The image below is scan result sorted by the percentage from the 52-week high. Notice that six of the nine sector SPDRs are within 3% of a 52-week high. Buying pressure is clearly stronger than selling pressure when an ETF is near a 52-week high. After all, it is impossible to be near a 52-week high without some sort of advance. XLU and XLP are clearly leading and the closest, but they are not alone! Taken together, the six sectors within 3% of a 52-week high account for 59.5% of the S&P 500. This is net bullish and supports an uptrend.
All Nine Sector SPDRs have Golden Crosses Working
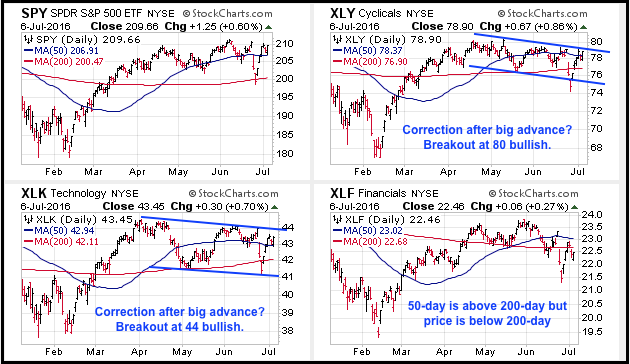
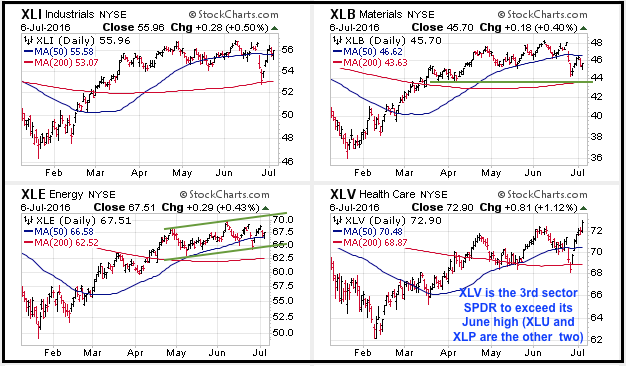
Also note that the 50-day SMA is above the 200-day SMA for all nine sectors SPDRs. A golden cross occurs when the 50-day SMA moves above the 200-day SMA. Eight of the nine are trading above their 200-day SMAs. XLY, XLK and XLV broke their 200-day SMAs briefly in late June, but these breaks did not hold. XLF is the only one trading below this moving average and the weakest of the nine. I would not become concerned with a broad market downtrend until we start to see some death crosses in the sector SPDRs (50-day moving below 200-day).
Healthcare SPDR Clears Benchmark High
I wrote about resilience in the HealthCare SPDR (XLV) a week ago and this sector continues to impress on the price chart. The June highs represent a benchmark high of sorts and names trading above the June high show relative "chart" strength. Only three sector SPDRs are above their June highs: XLP, XLU and, now, XLV.
Overbought, Oversold and the Bigger Trend
Greg Morris penned a nice article entitled: Overbought / Oversold. It is not an article on the best way to determine overbought and oversold conditions. Instead, Greg explains the futility in trying to determine overbought and oversold. At the very least, this article challenges us to THINK about our analysis process. Thinking hurts my head sometimes, but it is a good exercise.
I think it is important to qualify overbought and oversold conditions. Chartists should not worry about overbought conditions in an uptrend because it takes strong buying pressure to become overbought. An "overbought" reading in an oscillator just confirms the underlying uptrend. Oversold conditions are important in an uptrend because these tell us that we have seen a pullback within the uptrend. In contrast to overbought conditions, a pullback within an uptrend is an opportunity.
I would also suggest that chartists qualify support and resistance levels the same way. Resistance is not important in an uptrend and should not even be marked. Why? Because higher highs and resistance breaks are expected in an uptrend. That is why it is an uptrend. Support levels, on the other hand are important because they are supposed to hold. A break below support, therefore, tells us that the demand-support dynamic may be changing and we need to re-evaluate the uptrend.
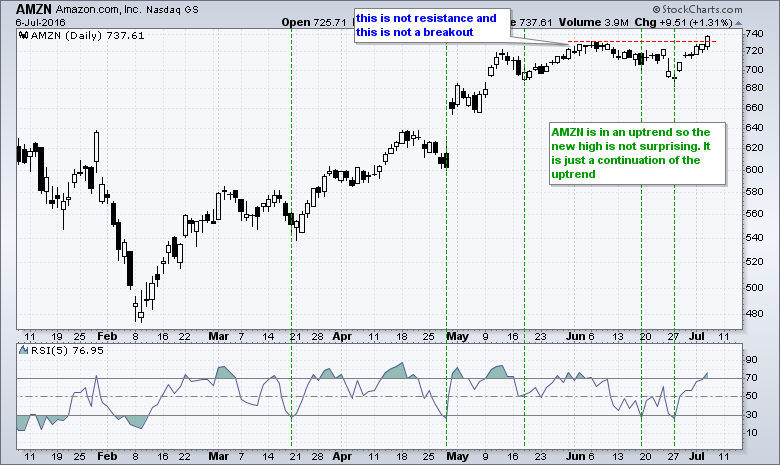
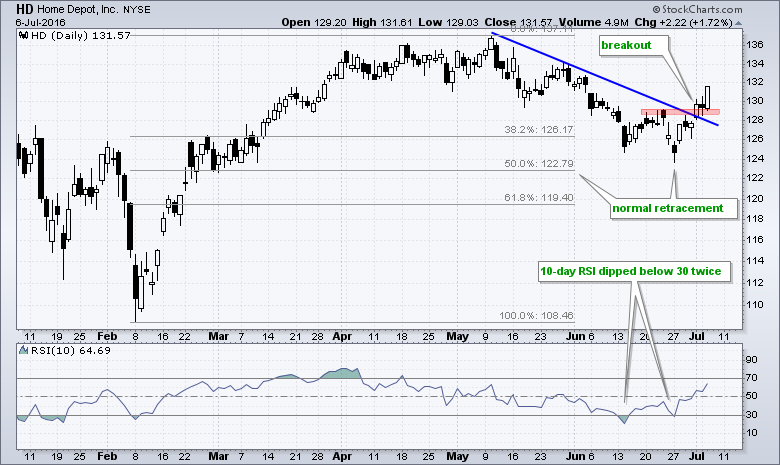
Amazon and Home Depot Power MarketVectors Retail ETF
Consumer discretionary has been one of the weakest sectors this year, but there are signs of improvement in two key areas: retail and housing. The MarketVectors Retail ETF (RTH) is leading with a hammer, gap and breakout over the last seven days. The triangle breakout signals a continuation of the February-April surge. Note that this hammer was pointed out in last week's commentary.
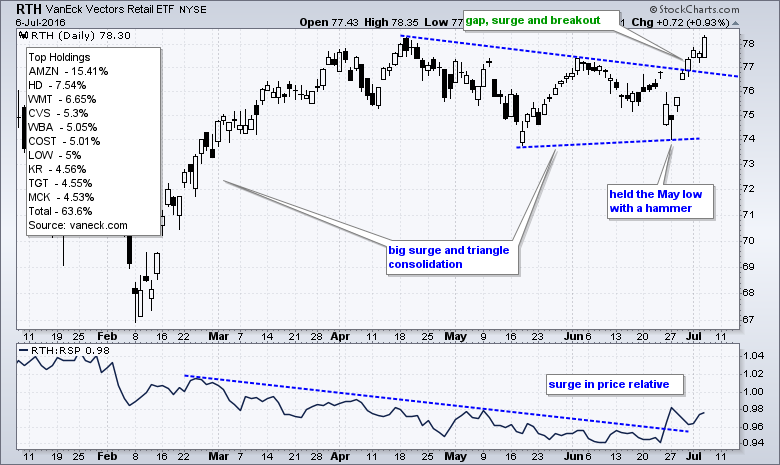
Amazon and Home Depot are the two top holdings and together account for around 23% of RTH. AMZN continues to lead the market as the stock hit a 52-week high on Wednesday. 10-day RSI did not generate any "oversold" readings from March to June, but 5-day RSI did dip below 30 four times.
HD retraced around 50% of its February-April surge and broke out with a move above 129 this week. This retracement is normal after a big advance and the breakout indicates that the correction is ending. Notice that 10-day RSI became oversold twice in June. 10-day RSI does not pick up as many short-term pullbacks as 5-day RSI.
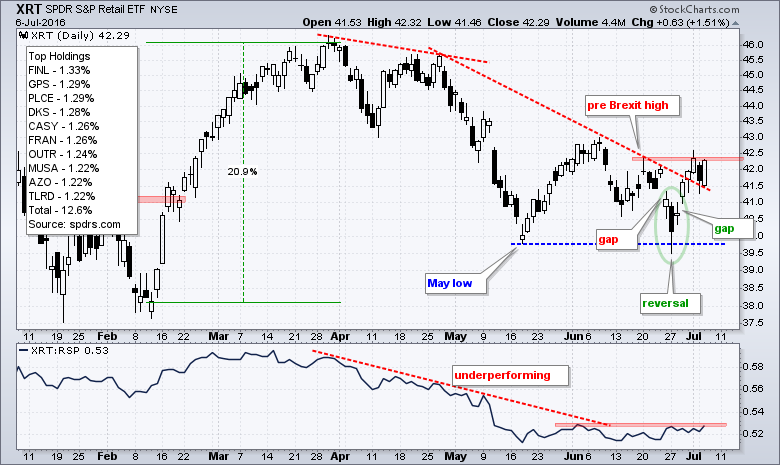
Retail SPDR Perks Up
The Retail SPDR (XRT) is a complete different beast because it equally weighted, more or less. XRT also has 95 stocks, whereas RTH has just 25. XRT, therefore, is a better representative of retail than RTH. XRT is not as strong as RTH, but the ETF is showing some strength the last six days with a gap-reversal and higher high. Notice that XRT exceeded the pre-Brexit high and this is a sign of short-term relative strength. The late June gap holds the key to this latest reversal attempt.
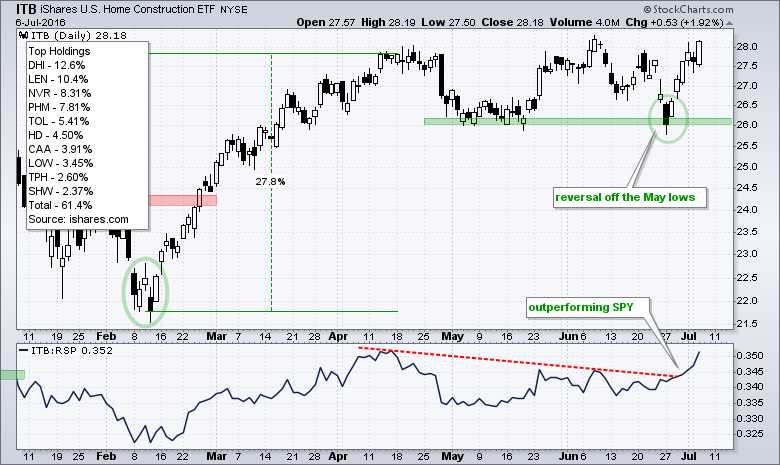
The Home Construction iShares (ITB) reversed off the May lows with a gap last week and is nearing a break above the June high. ITB has been one of the strongest ETFs the last six trading days.
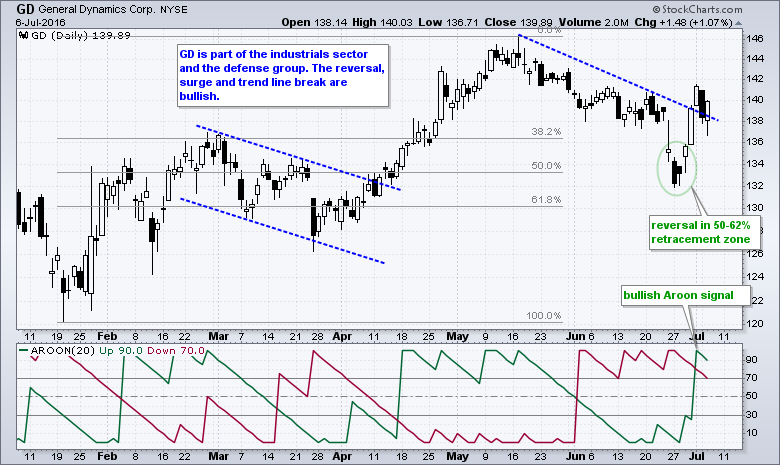
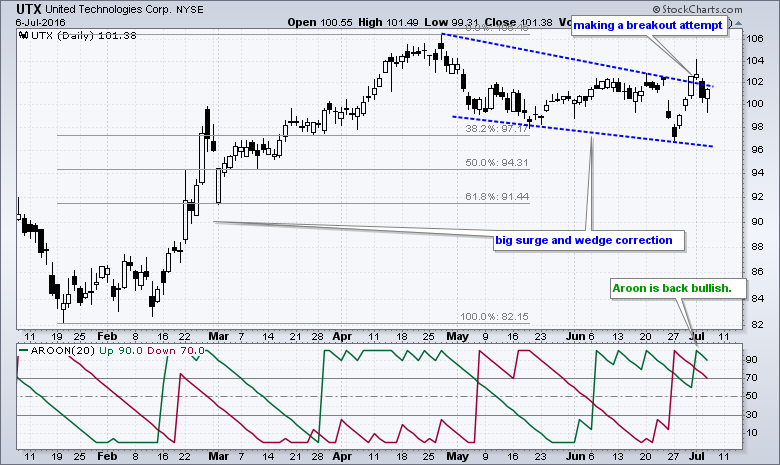
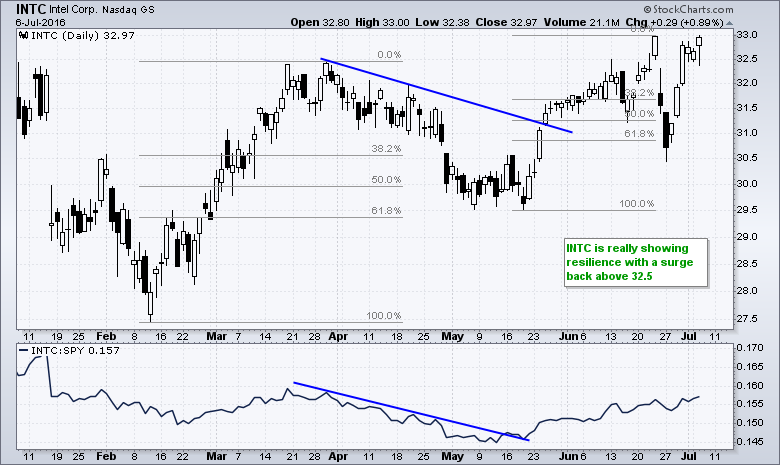
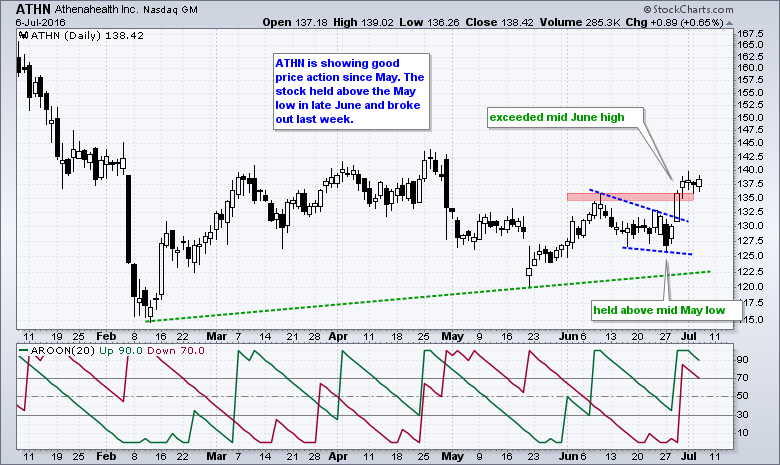
Stocks to Watch: GD, UTX, INTC, ATHN
The next charts highlight some stocks to watch in the coming days. Note that the employment report is Friday and earnings season kicks off next week. Thus, we can expect more volatility the rest of the month. What else is new!?
******************************************************
Measuring Risk On-Risk Off - Using charts to quantify stock, economic and credit risk.
PPO Trading Strategy - How to use 3 PPOs to develop a trend-reversion trading strategy.
Long-term Trend Indicators - Using the PPO, EMA Slope and CCI to determine the trend.
ETF Master ChartPack - 300+ ETFs organized in a Master ChartList and in individual groups.
Follow me on Twitter @arthurhill - Keep up with my 140 character commentaries.
****************************************
Thanks for tuning in and have a good day!
--Arthur Hill CMT
Plan your Trade and Trade your Plan
*****************************************


