Bullish Resolution to an Already Bullish Chart // QQQ Breaks Channel Trend Line // New Highs Surge in Nasdaq 100 // Creating an Up-Down Pair Chart // Small-caps Come Alive // Consumer Discretionary Leads all Sectors // RCD Breaks June High //// .....
Bullish Resolution to an Already Bullish Chart
The stock market is up sharply over the last eight days with small-caps and large-cap techs leading the charge. I picked eight days because this timeframe captures price action since the June low, which occurred the Monday after the Brexit vote. Note that SPY is leading based on chart action because it is the first to exceed its June high. The June high is a "benchmark" high that chartists can use when comparing charts. Stocks and ETFs above the June high show relative chart strength.
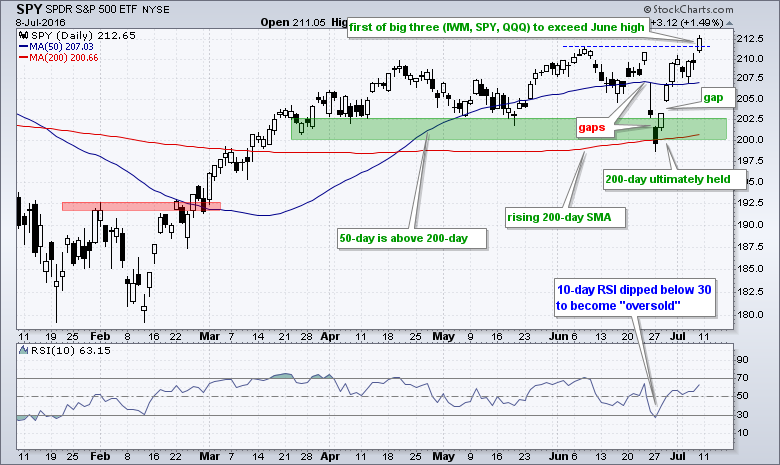
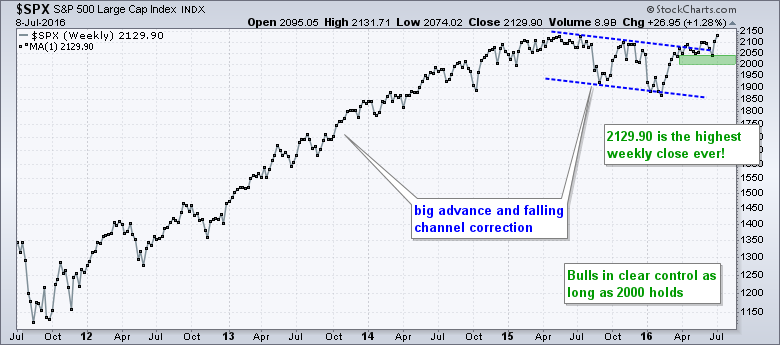
As noted in ChartWatchers last weekend and Art's Charts on Thursday, the higher high in SPY was not unexpected because the bulk of the evidence was already bullish. The 50-day SMA was already above the 200-day SMA, the 200-day SMA was already rising and SPY ultimately held the 200-day in late June. The chart below shows weekly closing prices and the S&P 500 closing at its highest weekly close ever.
QQQ Breaks Channel Trend Line
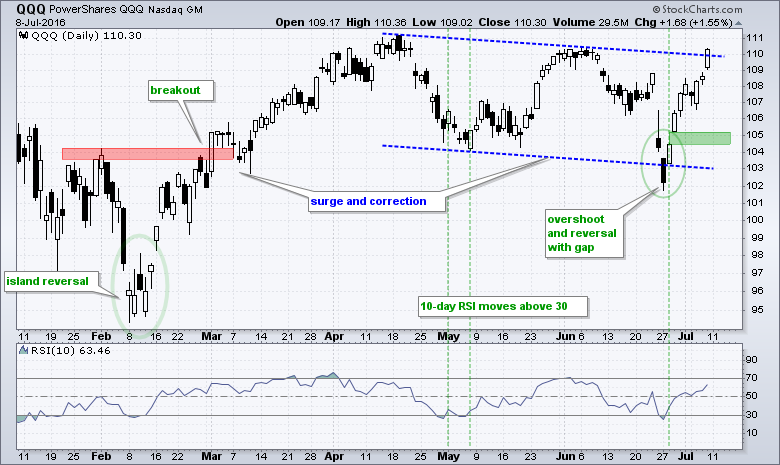
QQQ made a monster move over the last eight days and broke above the channel trend line on Friday. This is also not a surprise because I viewed this channel as a correction within a bigger uptrend. The surge from mid February to mid April set the bullish tone and the ETF was entitled to a correction. This channel represents that correction and the trend line break signals an end to this correction (resumption of uptrend). The only potential negative here is that QQQ is up around 8% in eight days and getting a bit extended. Keep in mind, however, that it takes strong buying pressure to get become "overbought" or "overextended" and this is more bullish than bearish for the medium term.
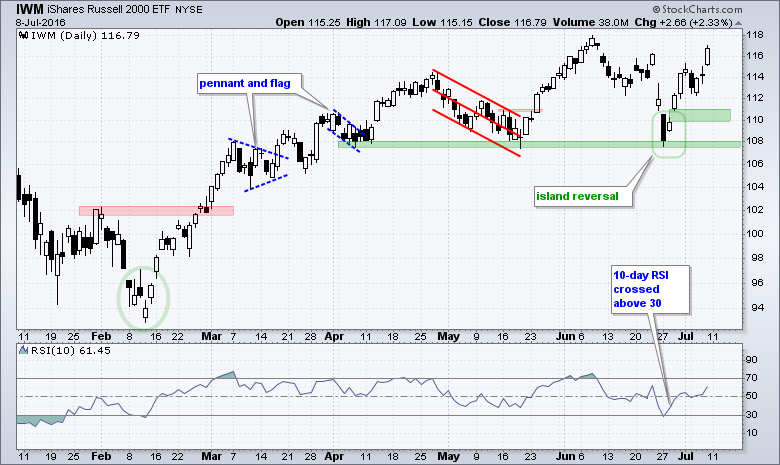
IWM was the only one of the big three to hold its May low during the late June dip. The ETF then formed an island reversal in late June and surged back above 116 over the last eight days. This move affirms support in the 108 area and I would expect the ETF to exceed its June high because the bigger trend is up.
New Highs Surge in the Nasdaq 100
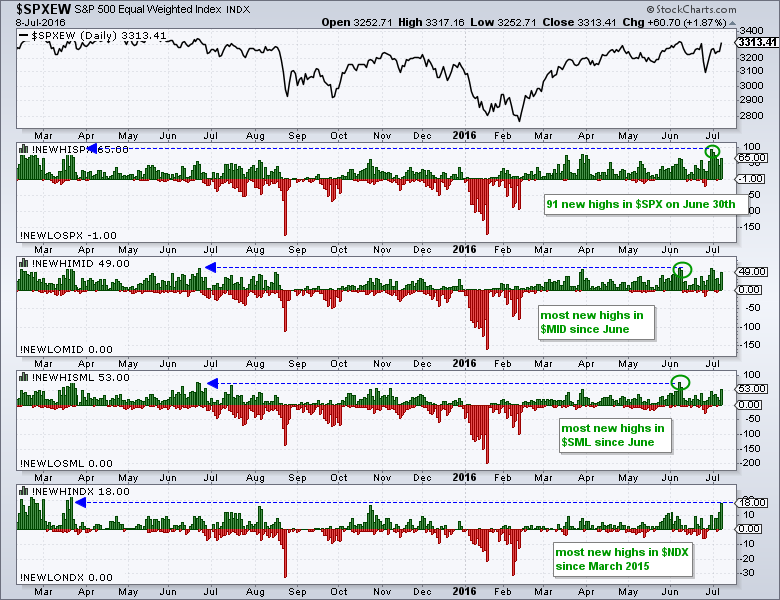
The resurgence of the Nasdaq 100 and large-cap techs can be seen with a high-low pair chart. This chart shows new highs and new lows for the S&P 500, S&P MidCap 400, S&P Small-Cap 600 and Nasdaq 100. First, notice that there were 91 new highs in the S&P 500 on June 30th. This means 18.2% of stocks in the index hit a new high at the end of June. Not bad. Second, new highs continue to outpace new lows in the S&P MidCap 400 and S&P Small-Cap 600. This gives the bulls a clear edge. Third, notice that 18 stocks in the Nasdaq 100 hit new highs on Friday. This means 18% of the stocks in this index hit new highs and this is clearly bullish.
Creating an Up-Down Pair Chart
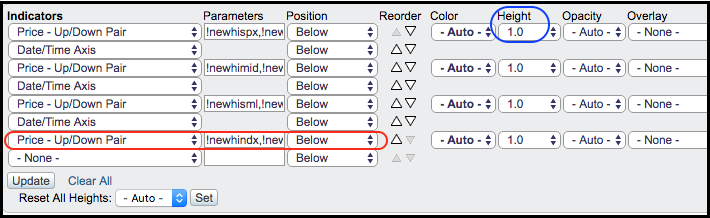
The chart above was created using "Price - Up/Down Pair" as an indicator and then entering "!NEWHINDX,!NEWLONDX" in the parameters box (without quotation marks). The two symbols are separated by a comma. See the red oval in the image below for an example. I also added "Date/Time Axis" as an indicator to help separate the high-low pairs and I set the height of each chart at 1 to make them equal. Click on the chart or the image below to see a live SharpChart. You can then save this chart to one of your ChartLists.
Small-caps Come Alive
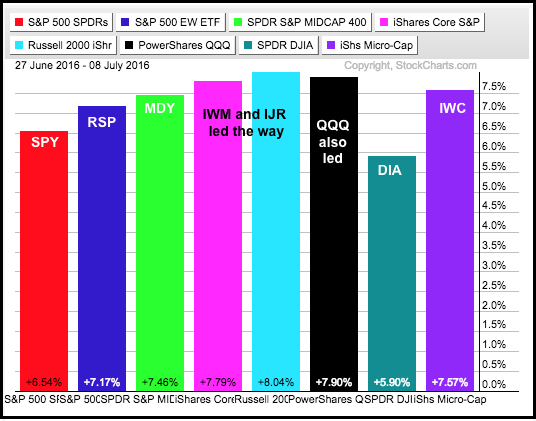
Even though the Russell 2000 iShares (IWM) and the S&P SmallCap iShares (IJR) did not exceed their June highs, they certainly came alive over the last eight days and led the major index ETFs in percentage gain. The PerfChart below shows the 8-day percentage gain for eight broad index ETFs. SPY was up 6.54% and DIA was up 5.9%. Notice that MDY (mid-caps), IWM, IJR and QQQ were up more than 7.4% and outperformed over the last eight days. This reflects a healthy risk appetite and could foreshadow further gains in the stock market.
Consumer Discretionary Leads all Sectors
The equal-weight sector PerfChart shows the EW Consumer Discretionary ETF (RCD) lead the equal-weight sectors with an 8.48% gain. This is especially promising because RCD was one of the lagging sectors and it is the most economically sensitive sector. Consumer discretionary includes retailers, restaurants, autos and media stocks. I am using the equal-weight version because it is more representative of the sector as a whole.
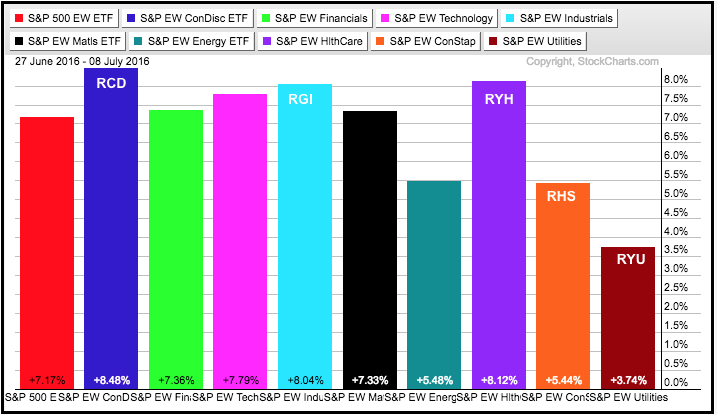
Elsewhere, note that the EW Industrials ETF (RGI) and the EW Healthcare ETF (RYH) outperformed the EW S&P 500 ETF (RSP) over the last eight days. In addition, notice that the EW Utilities ETF (RYU) and EW Consumer Staples ETF (RHS) underperformed over this timeframe.
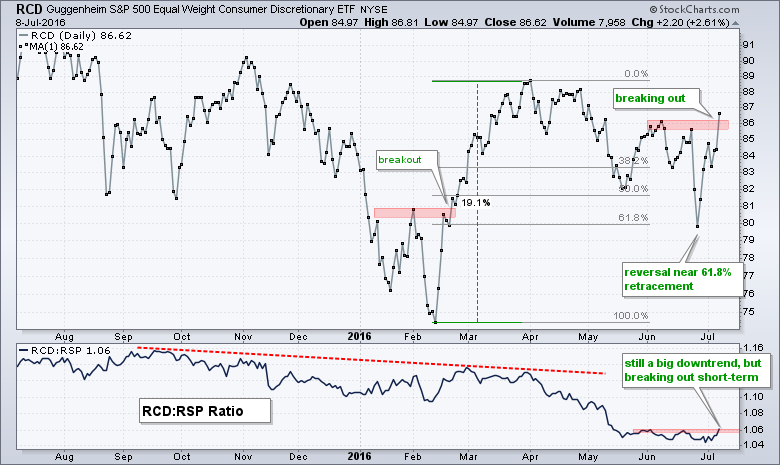
RCD Breaks June High
Speaking of benchmark highs, the EW Consumer Discretionary ETF surged above its June (benchmark) high this week and suddenly shows some chart strength. Notice that the ETF surged some 19% from mid February to late March and then corrected with a rather sharp decline to around 80. The ETF then managed to reverse off the 61.8% retracement, which is a classic Fibonacci number, and surge above its prior highs.
******************************************************
Measuring Risk On-Risk Off - Using charts to quantify stock, economic and credit risk.
PPO Trading Strategy - How to use 3 PPOs to develop a trend-reversion trading strategy.
Long-term Trend Indicators - Using the PPO, EMA Slope and CCI to determine the trend.
ETF Master ChartPack - 300+ ETFs organized in a Master ChartList and in individual groups.
Follow me on Twitter @arthurhill - Keep up with my 140 character commentaries.
****************************************
Thanks for tuning in and have a good day!
--Arthur Hill CMT
Plan your Trade and Trade your Plan
*****************************************


