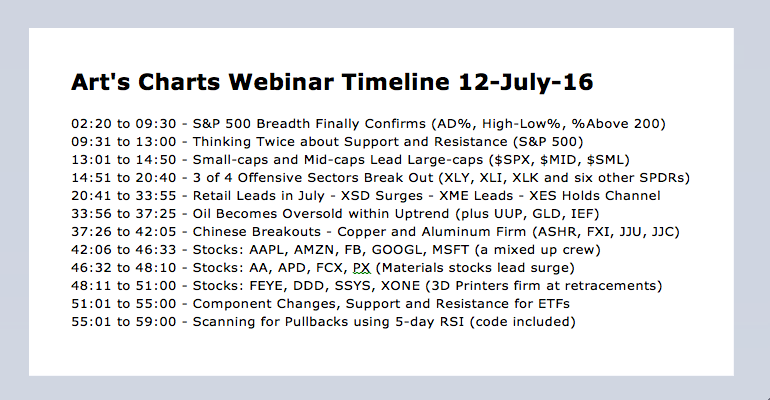
Webinar Video for Tuesday, July 12th
S&P 500 Reaches Uncharted Territory // Support and Resistance for Indexes and ETFs // Small-caps and Mid-caps Outperforming // S&P 500 Breadth Finally Confirms // Small-cap New Highs Surge // Percent above 200-day Stays Bullish // Webinar Preview //// .....
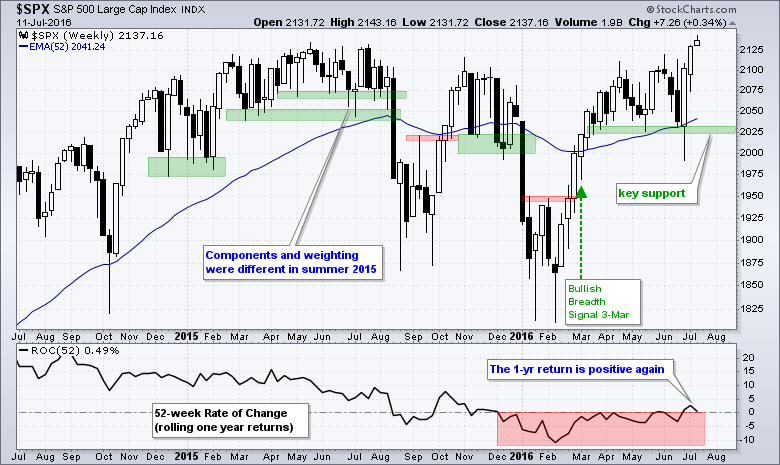
S&P 500 Reaches Uncharted Territory
The S&P 500 surged to a new high on Monday and higher highs are bullish. Even though one new high will eventually mark a significant peak, I do not see that in the cards right now. I am also not concerned with "resistance" from the 2015 highs. There are two reasons. First and foremost, the trend and breadth indicators are bullish (and have been bullish since early March). This means I expect higher prices and prior highs to be broken. The concept of resistance does not make sense when the current evidence is bullish. My focus remains on support and the level it would take to prove the bullish argument otherwise. At this point, I see a support zone around 2025 and would re-evaluate on a close below 2020.
Support and Resistance for Indexes and ETFs
The second argument against the validity of resistance, and support for that matter, is the make up of the index itself. Keep in mind that the stocks and weightings in the S&P 500 were different a year ago. The further back in time we go, the bigger the difference in the index. The differences may seem relatively trivial for the S&P 500 because it has 500 stocks, but the differences for ETFs with a couple dozen stocks can be quite big.
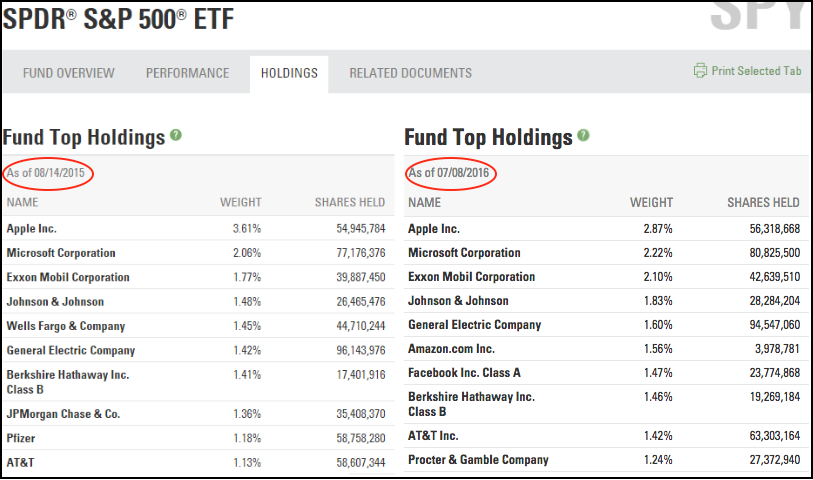
Using the S&P 500 SPDR (SPY) has our proxy, the image above shows the top ten stocks for SPY in August 2015 (left) and July 2016 (right). Wells Fargo, JP Morgan and Pfizer were in the top ten in August 2015, but they are not in the top ten now. Notice that Amazon, Facebook and Procter & Gamble are now in the top ten.
The S&P 500 is kind of like its own momentum fund because it rewards the winners and penalizes the losers. Amazon, Facebook and Procter & Gamble have been performing well and their weightings in the S&P 500 increased. This is one of the reasons why so many fund managers underperform the S&P 500.
In addition to weighting changes, note that 32 stocks have been removed from the S&P 500 since August. This means 32 stocks were added to the index. Again, the index in August 2015 was not the same index we are seeing in July 2016. Note that there is a component change in the S&P 500 almost every week.
I am not totally throwing out the notion of support and resistance. I would, however, use support and resistance ZONES with indexes and ETFs. In addition, support and resistance levels that are older than six months have less validity in my book. This is especially true when dealing with indexes and ETFs that have moving parts. It may be a different story for stocks because we are just talking about one stock.
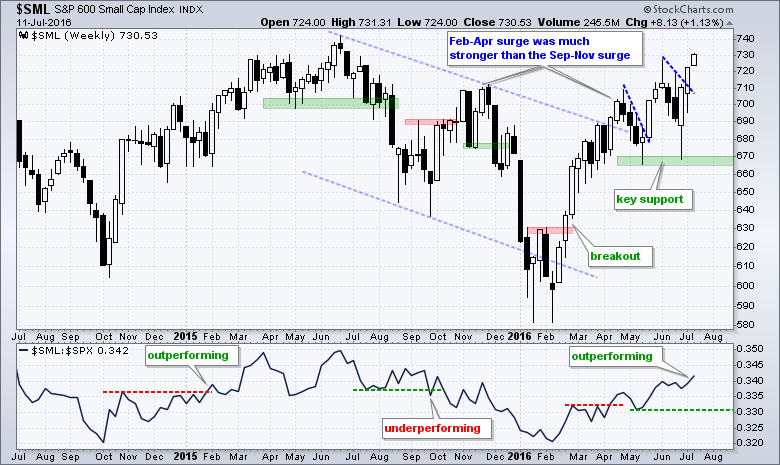
Small-caps and Mid-caps Outperforming
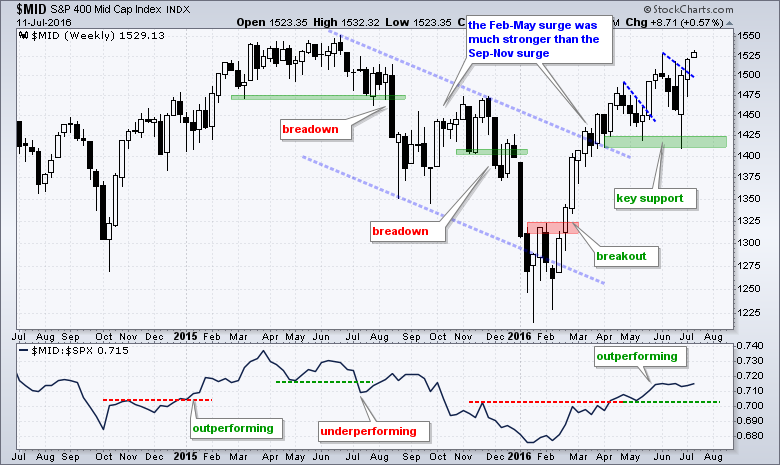
And now back to our regularly scheduled chart analysis....The S&P Small-Cap 600 led the charge over the last two weeks and exceeded its June high on Monday. There is nothing bearish on this chart and small-caps are outperforming large-caps. Notice that the price relative ($SML:$SPX ratio) has been moving higher since early February and this ratio is at its highest level since September. As noted below, the breadth indicators are bullish for $SML and this means I am not even looking at resistance levels. Instead, I am marking key support in the 665-670 area and will watch this level for signs of a reversal. The S&P MidCap 400 is also performing well with support marked in the 1410-1425 area.
S&P 500 Breadth Finally Confirms
The 10-day EMA for AD Percent is a breadth indicator that measures daily participation. AD Percent = (Advancing Stocks - Declining Stocks) / Total Stocks. This indicator turned bullish for the S&P 1500, S&P MidCap 400 and S&P Small-Cap 600 in early March, but fell short of a bullish signal for the S&P 500. A move above +30% is required for a bullish signal and the indicator reached 29.87 for the S&P 500. Nevertheless, three of the four indicators turned bullish in early March and the weight of the evidence has been bullish since then.
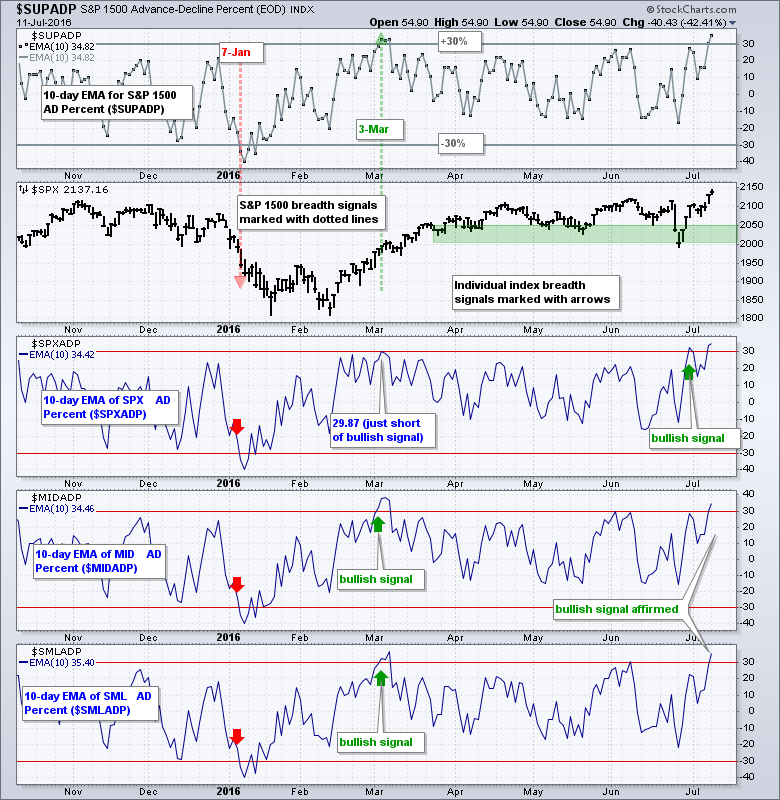
The chart above shows the indicator finally getting its bullish signal for the S&P 500 in late June. Also notice that the indicator move above +30% for all four indexes again in July and this affirms the existing bullish signals. The ability to surge above +30% shows a strong surge in daily participation (advancing stocks outnumbering declining stocks). This shows a broadening in bullish participation and this is bullish for the stock market overall.
Small-cap New Highs Surge
The surge in new highs in the S&P Small-Cap 600 is the most significant event in the market right now. The chart below shows High-Low Percent for the S&P 1500, S&P 500, S&P MidCap 400 and S&P Small-Cap 600. S&P 1500 High-Low Percent turned bullish on March 30th with a move above +10% and affirmed this bullish signal with subsequent moves above +10% in June and July.
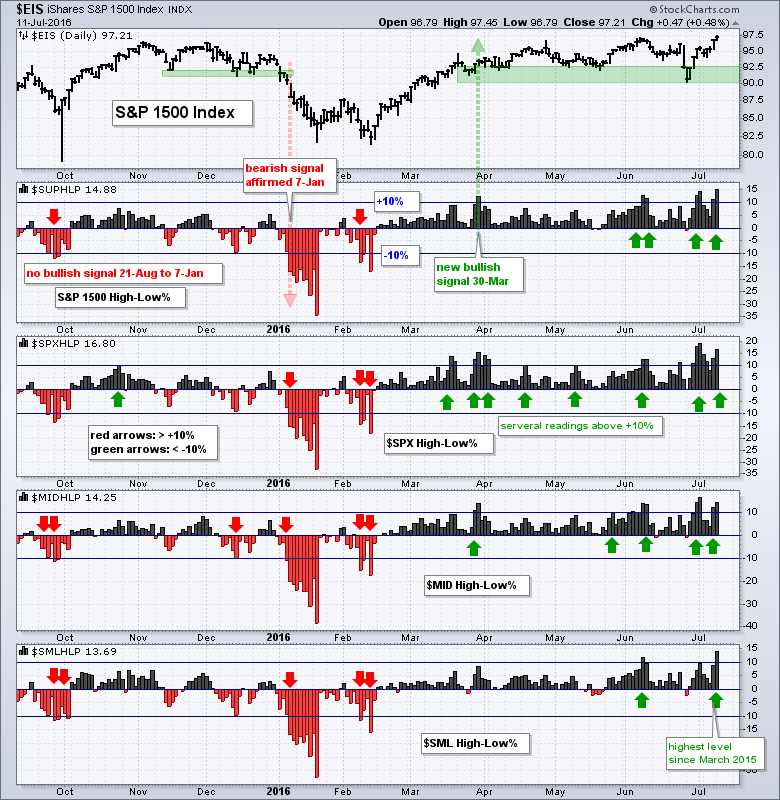
S&P 500 High-Low Percent remains the strongest of the market cap indexes as this indicator exceeded +15% three times in the last two weeks. Despite leadership in the S&P 500, I was most impressed with S&P Small-Cap 600 High-Low Percent because it surged to its highest level since March 2015. This means new highs are expanding among small-caps and this shows a stronger appetite for risk in the stock market.
Percent above 200-day Stays Bullish
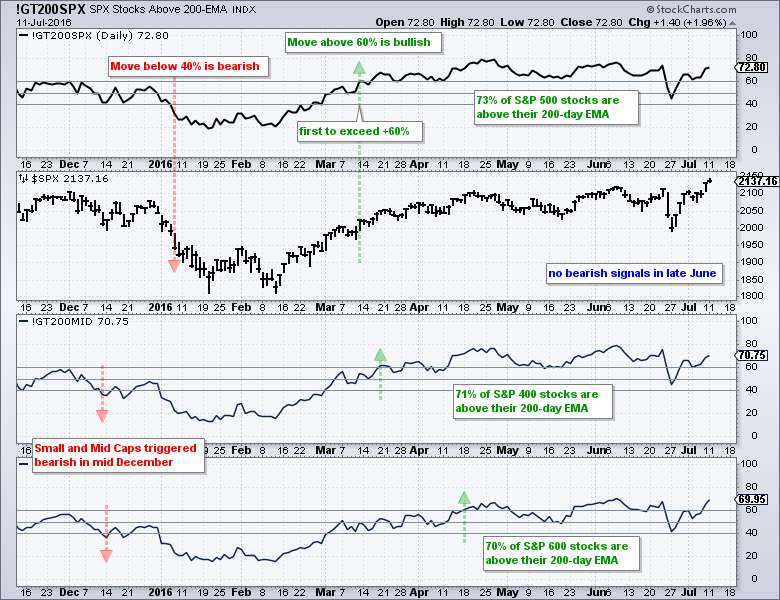
Around 71% of the stocks in the S&P 1500 are above their 200-day EMA and this is clearly more bullish than bearish. The chart below shows this indicator for the S&P 500, S&P MidCap 400 and S&P Small-Cap 600. The numbers range from 69.95% to 72.80% and the weighted average of the three is 71%. Notice that all three dipped below 50% in June, but they did not break below 40% for a bearish signal. This is why I set my bullish (60%) and bearish (40%) thresholds just above and below the mid point (50%). I am trying to allow a little wiggle room and not flinch with the volatility.
******************************************************
Measuring Risk On-Risk Off - Using charts to quantify stock, economic and credit risk.
PPO Trading Strategy - How to use 3 PPOs to develop a trend-reversion trading strategy.
Long-term Trend Indicators - Using the PPO, EMA Slope and CCI to determine the trend.
ETF Master ChartPack - 300+ ETFs organized in a Master ChartList and in individual groups.
Follow me on Twitter @arthurhill - Keep up with my 140 character commentaries.
****************************************
Thanks for tuning in and have a good day!
--Arthur Hill CMT
Plan your Trade and Trade your Plan
*****************************************


