SystemTrader // Introduction // Picking the Market Benchmark // Advance-Decline Percent // Massaging the AD Data // Measuring Significant Shifts // Dividing, Conquering and Affirming // Conclusions AD Percent Indicators at StockCharts //// . . . . .
Introduction
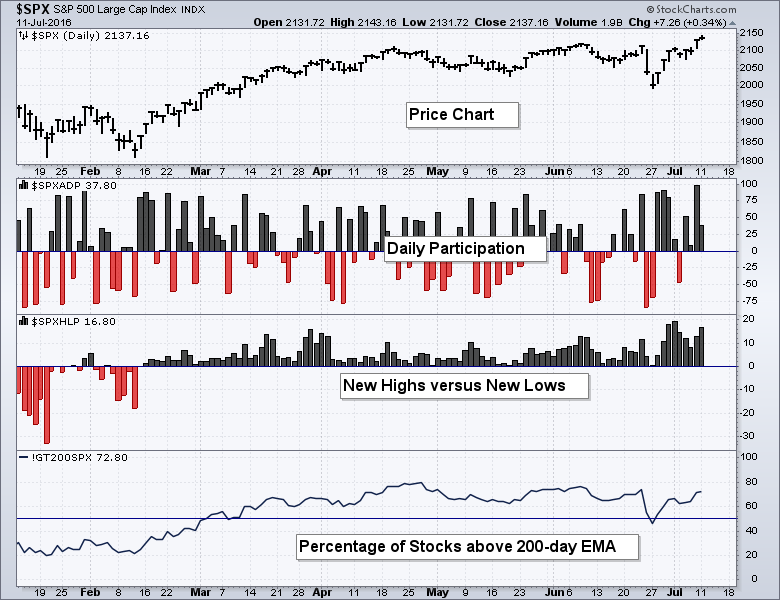
This is the first in a multi-part series on the key breadth indicators I use to determine the broad market environment. Most readers are familiar with these indicators, but there are still lots of questions regarding key levels and interpretation. Today's article will cover Advance-Decline Percent. Future articles will cover High-Low Percent and the Percentage of Stocks above the 200-day EMA. I will show how to create a framework for broad market analysis using these breadth indicators and some basic price analysis. This weight of the evidence approach can then be used to define the broad market environment.
Programming Note: I will be off on Wednesday, Thursday and Friday for a little family vacation. This breadth series and the SystemTrader articles will resume after vacation.
Price chart analysis is important, but price does not always tell the entire story, especially when it comes to broad market analysis. The S&P 500, for example, has 500 moving parts (stocks) and the index level does not always reflect what is happening inside the index. Breadth analysis allows us to look inside and take the vital signs for the stock market. In short, breadth indicators measure the degree of participation and help identify significant shifts in participation.
By combining price analysis with breadth analysis, my goal is to determine the overall market environment. Are we in a bull market environment or a bear market environment? This is extremely important because it tells us when to embrace risk and when to avoid risk. Chartists want to embrace risk and be long beta (risk) when the broad market environment is bullish. Chartists want to shun risk, and be defensive when the broad market environment is bearish.
Picking the Market Benchmark
While the S&P 500 is perhaps the most important market benchmark, there are hundreds of other stocks in the stock market and this is why I use the S&P 1500 as my base for the stock market as a whole. The broad market breadth indicators are broken down into four index groups: S&P 1500, S&P 500, S&P MidCap 400 and S&P Small-Cap 600. The S&P 1500 represents the US stock market as a whole because it includes large-caps, mid-caps, small-caps, Nasdaq stocks and NYSE stocks. There are around 930 stocks from the NYSE and 570 stocks from the Nasdaq.
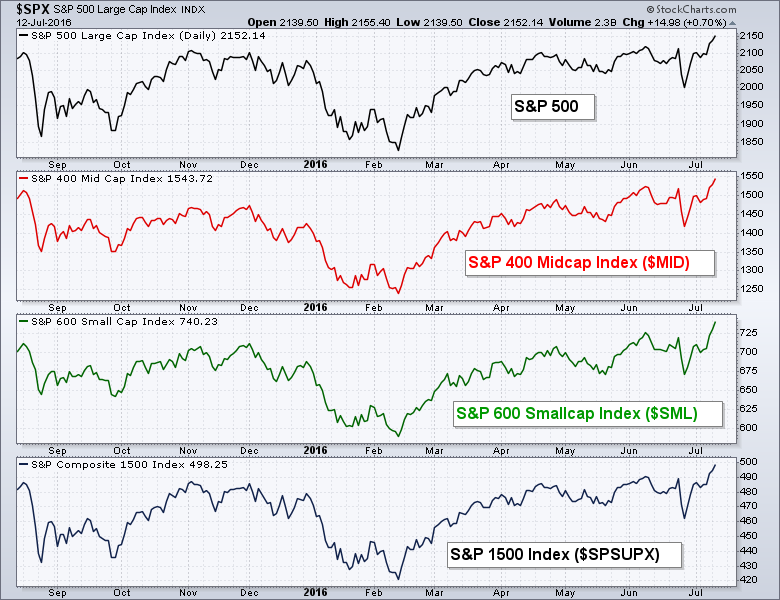 The S&P 1500 is a "complete" index because it captures all aspects of the stock market. Breadth indicators based solely on stocks in the NYSE are seriously deficient because they exclude Nasdaq stocks. Hard to imagine a broad market indicator that does not include Apple, Microsoft, Google, Facebook, Cisco, Amgen, Celgene, Amazon, Starbucks, Comcast, Netflix, Ross Stores, Expedia, Costco and many others key Nasdaq stocks.
Advance-Decline Percent
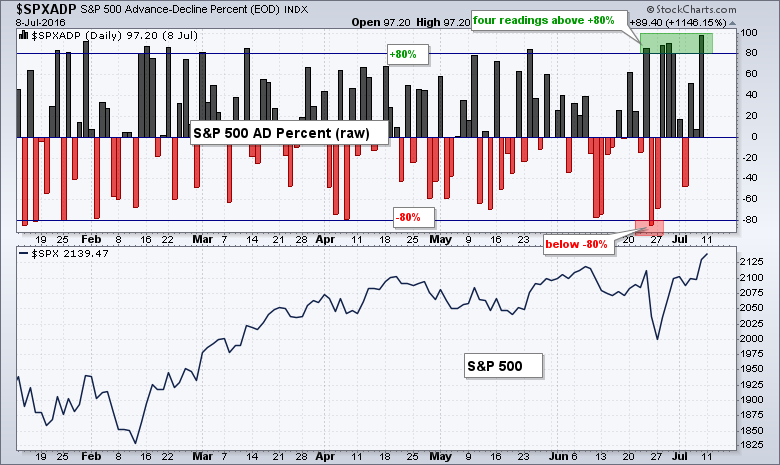
The first indicator is based on AD Percent, which is the percentage of net advances (advancing stocks less declining stocks). This indicator shows us the degree of participation on a daily basis. Readings above +80% show strong upside participation, while readings below -80% show strong downside participation.
AD Percent = (Advances - Declines)/ Total Issues
Massaging the AD Data
The raw indicator is quite choppy with alternating up and down days. Chartists, therefore, need to "massage" the data to produce an indicator for analysis purposes. Cumulative AD Percent produces an AD Line and a moving average of AD Percent produces an oscillator. Chartists can compare the AD Line to the price plot of the S&P 500 for signals and confirmations.
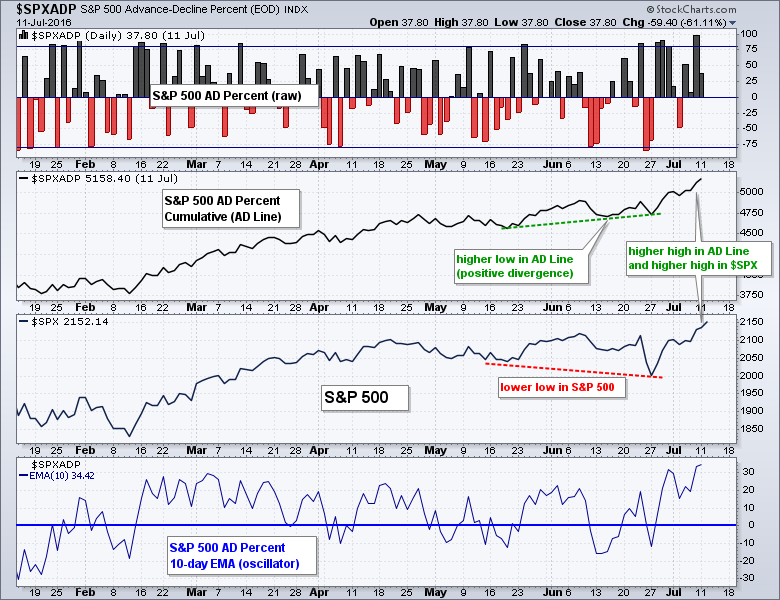 Notice how the AD Line formed a higher low from May to June and the index formed a lower low. This is a positive divergence and it suggests that underlying breadth is stronger than the index (internal strength). The AD Line then exceeded its June high in early July and the S&P 500 followed suit. The means the AD Line confirmed the new high in the index.
Measuring Significant Shifts
While there is nothing wrong with an AD Line, I prefer to use an exponential moving average and look for significant short-term swings in breadth. Namely, I am using a 10-day EMA of AD Percent and looking for crosses above +30% or below -30%. A move above +30% by the 10-day EMA shows a strong bullish expansion in AD Percent (participation) in a short period of time. Conversely, a move below -30% shows a strong bearish expansion in a short period of time. I deem these expansions significant enough to signal the start of an extended trend.
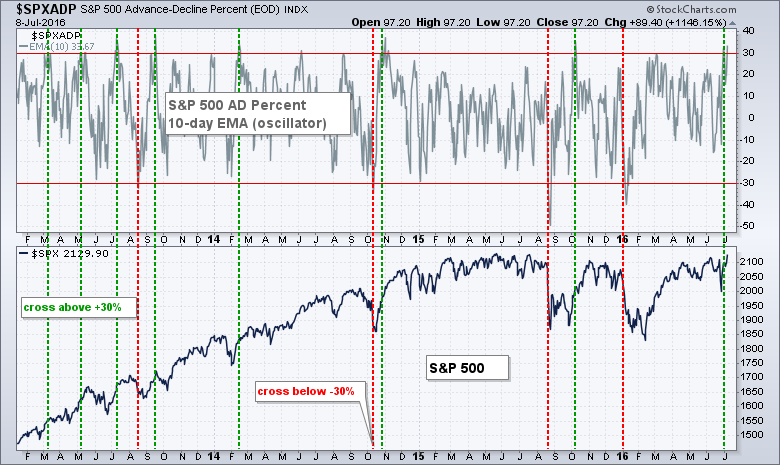 I came up with these levels by a process of elimination. Crosses above +25% and below -25% produced too may signals, while crosses above +35% and below -35% produced too few signals. I chose ten days because I am looking for a powerful short-term move to signal a significant change in participation. 20 days is a bit too long and 5 days is too short. Keep in mind that these settings are my personal preferences and one size does not fit all trading styles. These are just the settings I have settled on after years of chart watching.
Dividing, Conquering and Affirming
Chartists can break down the S&P 1500 for more insight into the market environment. Signals in the S&P 1500 set the tone for the broader market, while signals in the S&P 500, S&P MidCap 400 and S&P Small-Cap 600 set the tone for market cap performance. Basic math tells us that we need signals from at least two of the three market cap indexes to get a signal in the S&P 1500. In addition, using more than one index means we are not reliant on one index for signals.
The next chart shows the 10-day EMA of AD Percent for the S&P 1500, S&P 500, S&P MidCap 400 and S&P Small-Cap 600. S&P 1500 breadth triggered bullish in early March 2015 because there were bullish signals in S&P MidCap 400 breadth and S&P Small-Cap 600 breadth. This broad market bullish signal reversed the broad market bearish signal from early January 2014. Note that S&P 500 breadth fell just short of a signal (+29.87) and did not clear +30%. This shortcoming was not a concern because the other bullish signals ensured that the weight of the evidence was bullish.
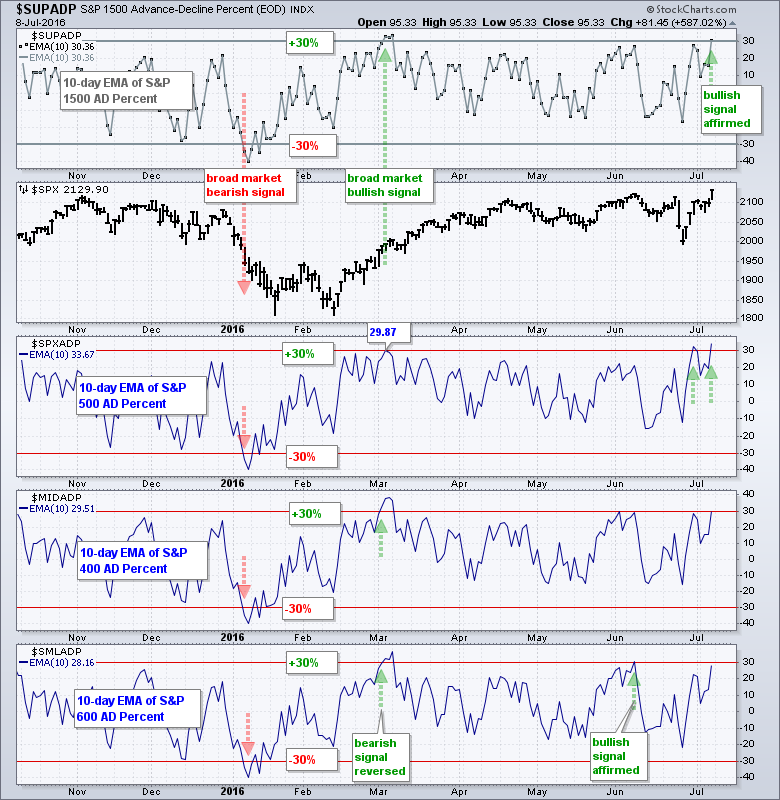 There are two types of signals: reversal signals and affirmation signals. A reversal signal reverses the prior signal (bullish to bearish or bearish to bullish). An affirmation signal comes after an initial signal and simply confirms the existing signal. The chart above shows the 10-day EMA for S&P SmallCap AD Percent reversing the bearish signal with a surge above +30% in early March 2015. The indicator did not dip below -30% for a bearish signal and again moved above +30% in early June. This subsequent signal simply affirmed the prior bullish reversal signal.
Conclusions
The 10-day EMA of AD Percent is a breath indicator designed to identify short and sharp shifts in participation. The idea for this indicator stems from the Zweig Breadth Thrust, which was detailed by our very own Greg Morris in a blog post. I tweaked the settings to fit my ideas on breadth signals.
The best place to catch a bullish breadth signal is after an extended decline. A bullish signal at this time signals a sudden and sharp shift in upside participation. The broadening of participation suggests that the institutions are active and such broad buying pressure can mark an important low.
Bearish breadth signals are tricky because the stock market has a long-term bullish bias. I ran a test of the 50-day SMA crossing the 200-day SMA for the S&P 500. This system worked great on bullish crossovers, but did not work well on bearish crossovers. While bearish breadth signals are not to be taken lightly, it may be difficult to profit from market declines.
AD Percent Indicators at StockCharts
StockCharts calculates and publishes AD Percent data for dozens of symbols (indexes and ETFs). These include the Dow Industrials, Nasdaq 100, Gold Miners ETF and the nine sector SPDRs. Chartists can find this list by searching the symbol catalog for "advance and decline and percent".
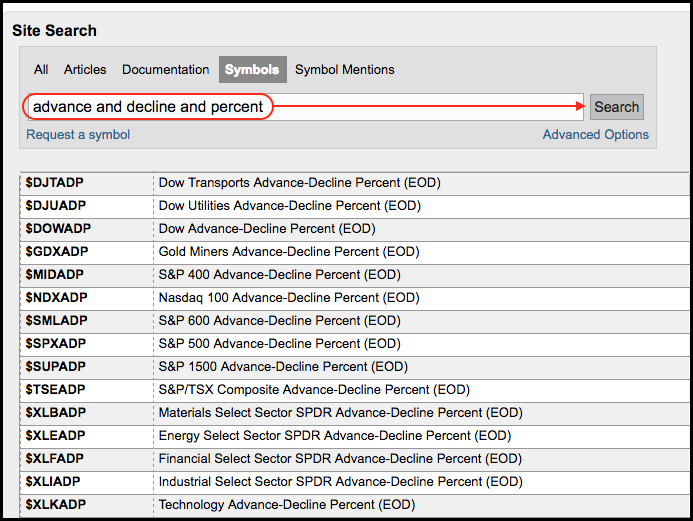 The charts shown in this article can serve as templates for creating other breadth indicators. Users can click on these charts to open them in the SharpCharts workbench. The indicators settings will then be visible below the charts. Simply replace the existing symbols with other AD Percent symbols to create different charts. Users can then click "save as" and place them in a ChartList for future reference.
****************************************
Thanks for tuning in and have a great day!
--Arthur Hill CMT
Plan your Trade and Trade your Plan
*****************************************

