 Webinar Video
 SPY Continues to Lead the Big Three // RSI Nears 70 for IWM // Sector SPDRs Reflect Broad Market Strength // Webinar Preview - Using Breadth Indicators // Submit a Webinar Question //// .....
SPY Continues to Lead the Big Three
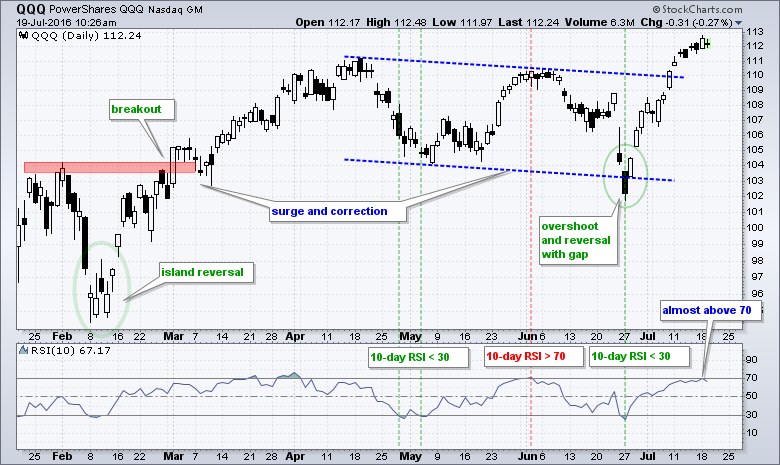
Stocks are up sharply over the last three weeks with small-caps leading the percentage gain. IWM is up 10.92%, QQQ is up 10.10% and SPY is up 8.42%. SPY, however, remains the overall leader because it was the only one to hit a 52-week high last week. Short-term, we do not need a momentum oscillator to figure out that stocks have come quite far in a short period of time. In fact, one could even say that stocks are (gasp) overbought. 10-period RSI is near 70 for all three ETFs.
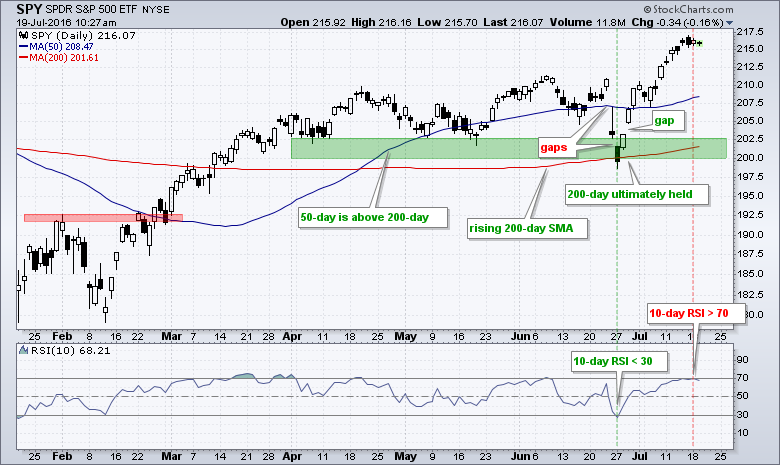
As noted before, the bigger trends are up and overbought conditions are expected in an uptrend. It takes strong buying pressure to push RSI to 70 and this is bullish overall. Admittedly, stocks are ripe for a short-term consolidation or pullback, but that does not mean it will happen and it does not mean a pullback is playable. Trying to make money off of pullbacks within uptrends is not my style. The bigger trend is the dominant force and it can pull trump at any time.
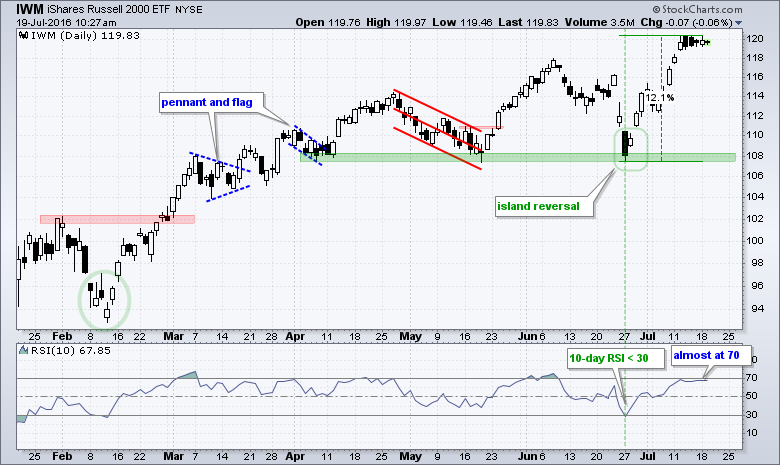
RSI Nears 70 for IWM
The way I see it, there are really only three plays for short-term traders. First, chartists taking advantage of oversold conditions on 27-June or the reversal-gap on 29-June can consider taking profits when 10-period RSI moves above 70. Second, traders can consider adding a trailing stop such as the Chandelier Exit. Third, traders who missed the move can wait for 5-day RSI to move below 30 for a short-term oversold condition, which would be an opportunity. I suggested 5-day RSI because it may be a while before 10-day RSI moves below 30 again.
Bottom line: The bigger trends are up and the breadth indicators are bullish. This has been the case since the major index ETFs broke price resistance in late February and the 10-day EMAs for AD Percent surged above +30% in early March. With the market environment bullish, pullbacks and short-term oversold conditions are viewed as opportunities, not threats. Short-term overbought conditions should be noted as a sign of strength that affirms the bigger uptrends.
Sector SPDRs Reflect Broad Market Strength
All nine sector SPDRs are above their 200-day moving averages, the 50-day moving averages are above the 200-day moving averages for all nine and six of the nine hit 52-week highs in July. Note that the Finance SPDR (XLF), Energy SPDR (XLE) and HealthCare SPDR (XLV) are the three that have yet to record a 52-week high. Even though the finance sector continues to lag overall, the Consumer Discretionary SPDR (XLY), Technology SPDR (XLK) and Industrials SPDR (XLI) hit new highs recently. This is more than enough to keep the broader market in bull mode and support the current uptrend.
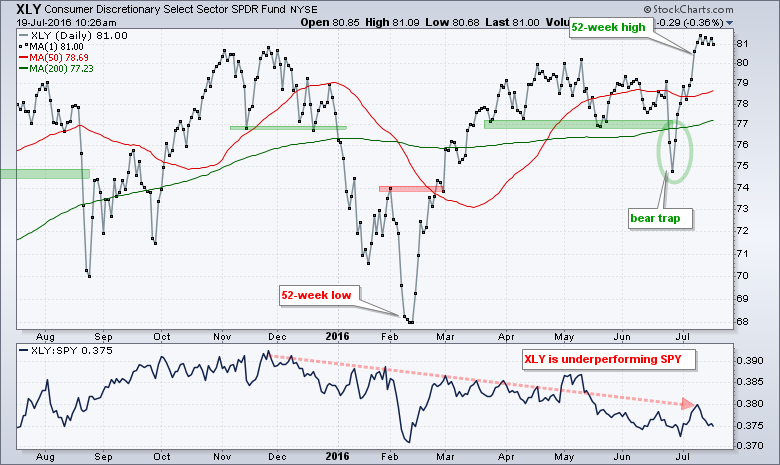
The next charts shows a sector SPDR with its 50-day SMA, 200-day SMA and price relative. I am showing the price relative because it does not tell the entire story. For example, the chart below shows XLY moving above its 2015 highs and hitting a 52-week high. This is a clear uptrend and this is clearly more bullish than bearish. The indicator window shows the XLY:SPY ratio moving lower since November and this means XLY is underperforming SPY. Keep in mind that underperformance is not the same as a downtrend on the price chart. I am not concerned with underperformance because the ETF is near a 52-week high. In other words, the price chart is just fine and the price chart holds more sway than the price relative (XLY:SPY ratio).
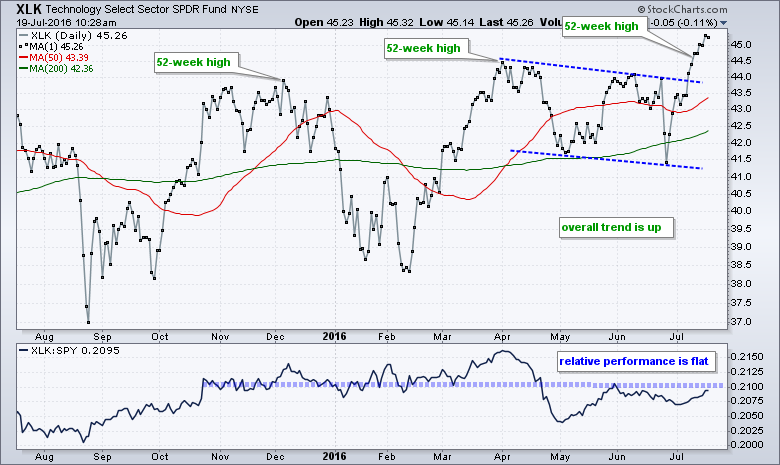
XLK has been working its way higher the past year with 52-week highs in December, April and July. It is a choppy uptrend, but it is a clear uptrend. Most recently, the ETF broke out of a channel consolidation. Even though there is nothing bearish about this chart, the price relative does not look so great because it has been flat since late October. This just means XLK has been performing in line with SPY the last 8-9 months. XLK is not underperforming and it is not outperforming. The is simply performing in line with the market and relative performance has little to do with the actual trend on the price chart.
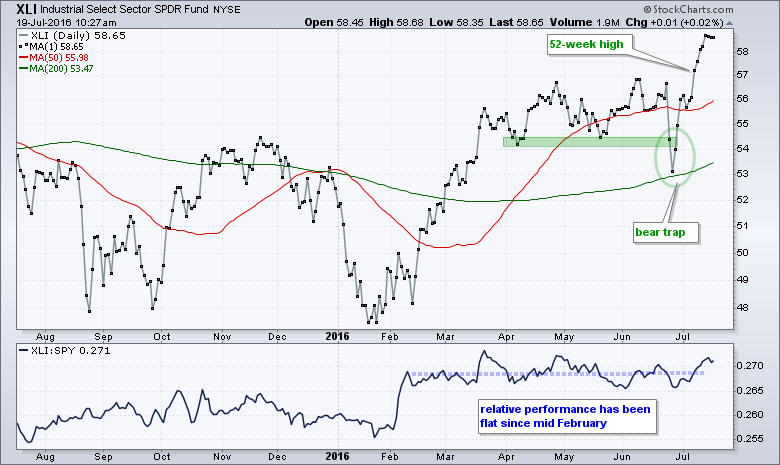
XLI broke below its April-May lows with a sharp decline in late June and then reversed just above the 200-day moving average. The ETF sprung a bear trap with the move back above broken support and surged to a 52-week high. Again, we can see that relative performance has been flat since mid February because the price relative (XLI:SPY ratio) has moved sideways since then. The price chart, however, shows clear strength and upside leadership with a 52-week high. I will cover the other six sector SPDRs in today's webinar.

******************************************************
Measuring Risk On-Risk Off - Using charts to quantify stock, economic and credit risk.
PPO Trading Strategy - How to use 3 PPOs to develop a trend-reversion trading strategy.
Long-term Trend Indicators - Using the PPO, EMA Slope and CCI to determine the trend.
ETF Master ChartPack - 300+ ETFs organized in a Master ChartList and in individual groups.
Follow me on Twitter @arthurhill - Keep up with my 140 character commentaries.
****************************************
Thanks for tuning in and have a good day!
--Arthur Hill CMT
Plan your Trade and Trade your Plan
*****************************************


