Nothing to Do but Trail a Stop // Reviving the Raff Regression Channel for QQQ // Chandelier Exit for IWM // Retail Continues to Impress // Applying the 5-day RSI-StochRSI Strategy to IEF and TLT // USO, BNO and XES Stutter after Bullish Signals // Scan Code for RSI-StochRSI Strategy // Emerging and Latin American Markets Turn Up //// .....
Nothing to Do but Trail a Stop
SPY notched another new high as the advance continued on Wednesday. The long-term trend is up and the evidence has been bullish since early March. Short-term, the ETF reversed in late June after 10-day RSI dipped below 30. At this point, long-term trend followers remain bullish until the weight of the evidence turns bearish. The April-June lows and the 200-day mark long-term support in the 200-203 area. Long-term, note that the 50-day is above the 200-day and the 200-day is rising. This means pullbacks are opportunities so I will be waiting for 5-day or 10-day RSI to dip below 30.
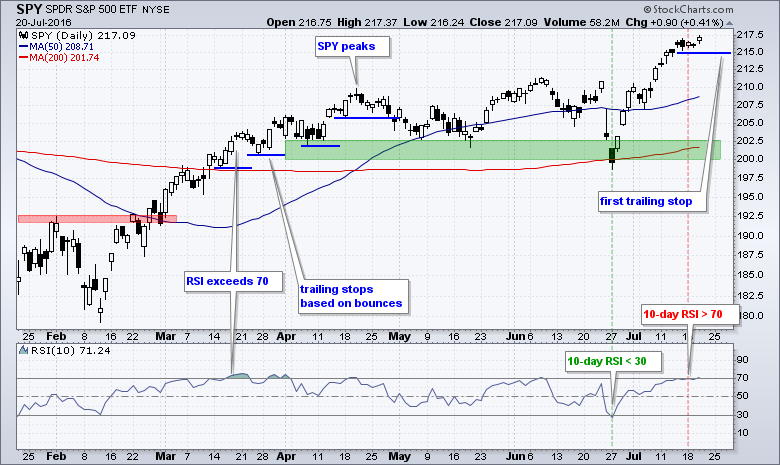
Short-term, SPY is up around 9% from the late June low and this is the strongest advance since February-March. RSI moved above 70 on March 16th and SPY did not peak until April 20th (a month later). The blue lines mark trailing stops based on reaction lows (troughs) after a small bounce. These troughs could be used to trail a stop-loss for short-term traders. With Wednesday's small bounce, I would set the first trailing stop at 215. Keep in mind that this is just an idea for a stop on a short-term long position. A break below this level would not actually be bearish because the bigger trends are up and the ETF is entitled to a pullback or consolidation after such a big advance.
Reviving the Raff Regression Channel for QQQ
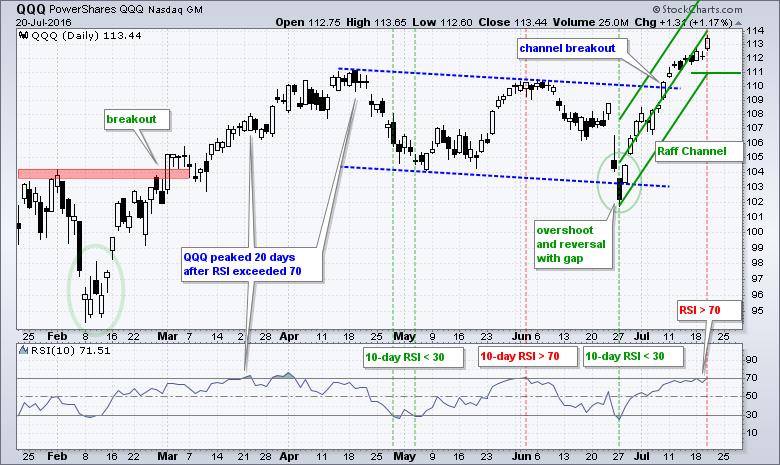
The current advance is so steep that I am bringing in the Raff Regression Channel to help define the short-term uptrend. The middle line is a linear regression and the outer lines are parallel. The width of the outer lines is based on the furthest high or low from the linear regression, which makes it a volatility-adjusted channel. The lower line ends around 111 and this marks the first short-term level to watch for a trend reversal. Keep in mind that a short-term trend reversal at this stage would not be that bearish because the bigger trend is up. In other words, a short-term pullback would be deemed a correction within this uptrend and this would be an opportunity, not a threat.
Chandelier Exit for IWM
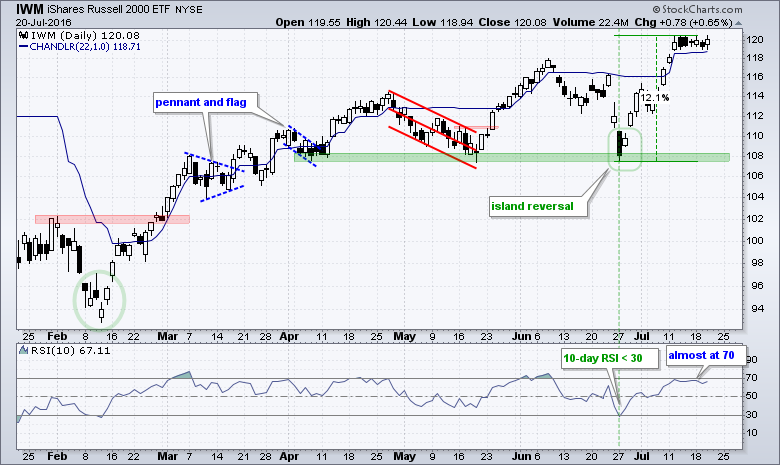
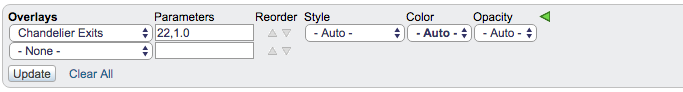
IWM petered out over the last few days and did not exceed last week's high. We can also see some relative weakness in RSI because it did not exceed 70. In contrast, 10-day RSI for QQQ and SPY did exceed 70. I would not read too much into a few days of relative weakness because the ETF surged around 12% in three weeks and is entitled to a rest. The thin blue line marks a Chandelier Exit (22,1). This is a trailing stop that is set 1 value of 22-day ATR below the recent high. Chartists can use a higher number to widen the stop (such as (22,2)). As set now, the Chandelier stop-loss will rise if prices rise and be triggered on a close below 118.71.
Retail Continues to Impress
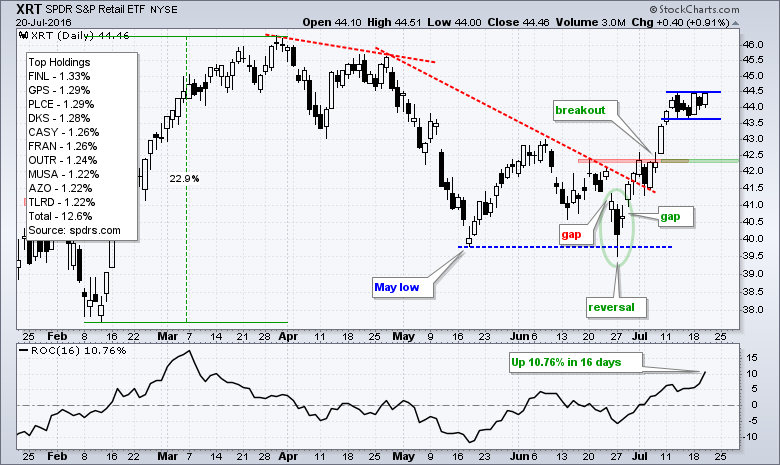
The Retail SPDR (XRT) is up over 10% in the last sixteen days and one of the leading industry group ETFs. Chart-wise, the ETF broke above the June high in early July and this is bullish. Retail was all but written off in mid May because Amazon was taking all the sales. Looks like the death of retail has been exaggerated just a bit. The breakout zone around 42.3 turns into the first support zone to watch on a pullback. Chartists can employ RSI to look for an oversold reading. There is also a chance that we do not get a pullback because a flag formed the last few days (blue lines). A breakout at 44.5 would signal a continuation higher.
Applying the 5-day RSI-StochRSI Strategy to IEF
Treasury bond ETFs pulled back rather sharply as the stock market rallied over the last two weeks. The chart below shows the 7-10 YR T-Bond ETF (IEF) with 5-day RSI and 5-day Stoch-RSI to outline a short-term trading strategy. I am not using 10-day RSI for IEF because it did not dip below 30 over the last six months (no signals). The red lines mark when 5-day RSI dips below 30 and the green lines mark when 5-day Stoch-RSI moves to 1. The principle at work here is to identify a pullback (RSI<30) and wait for some sort of turn around (StochRSI=1) before taking action.
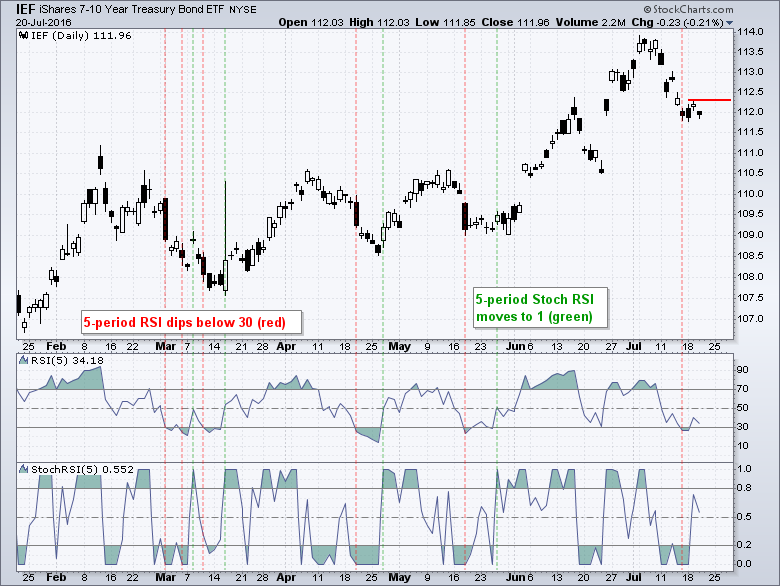
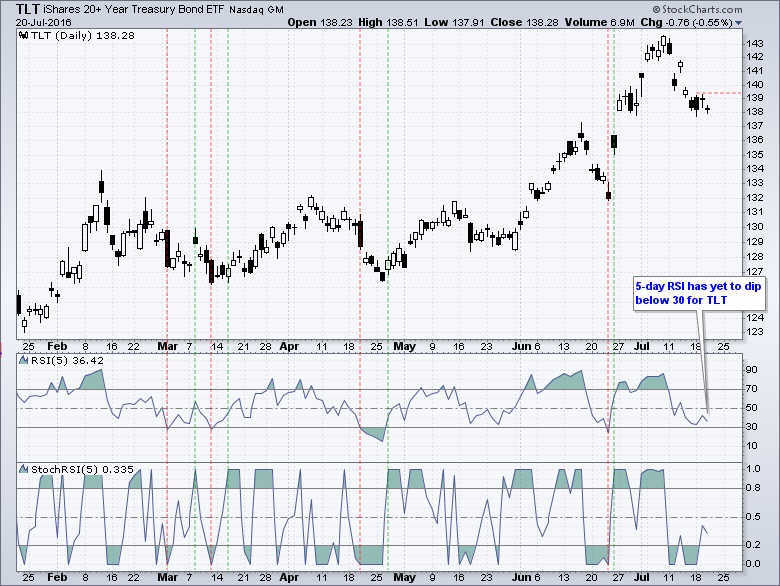
5-day RSI moved below 30 last week to signal a pullback, but we have yet to see a surge in StochRSI to suggest an upturn in momentum. Chartists can also look for a break above 112.3 to trigger a short-term signal. Before taking action, chartists should also establish their exit strategy. Plan your trade before taking action and then trade that plan. Chartists can consider exiting when RSI moves above 70 or setting a trailing stop when RSI moves above 70. The second chart shows the 20+ YR T-Bond ETF (TLT) with the same indicators.
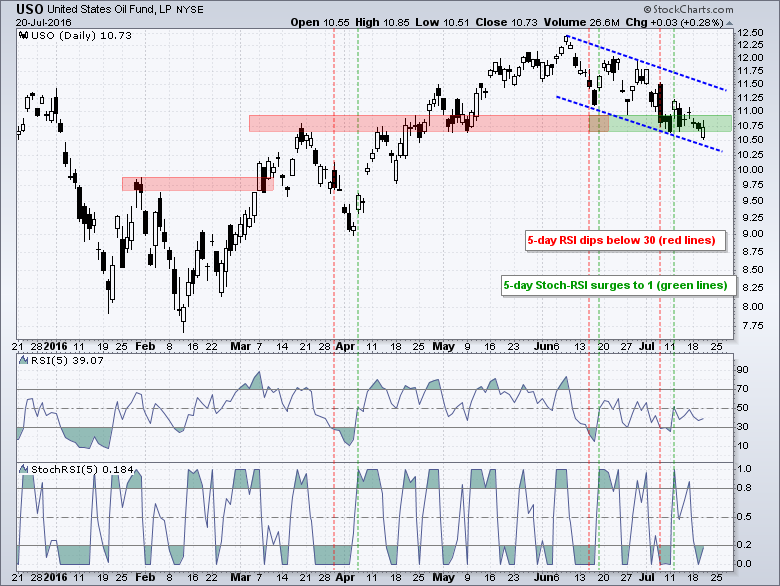
USO, BNO and XES Stutter after Bullish Signals
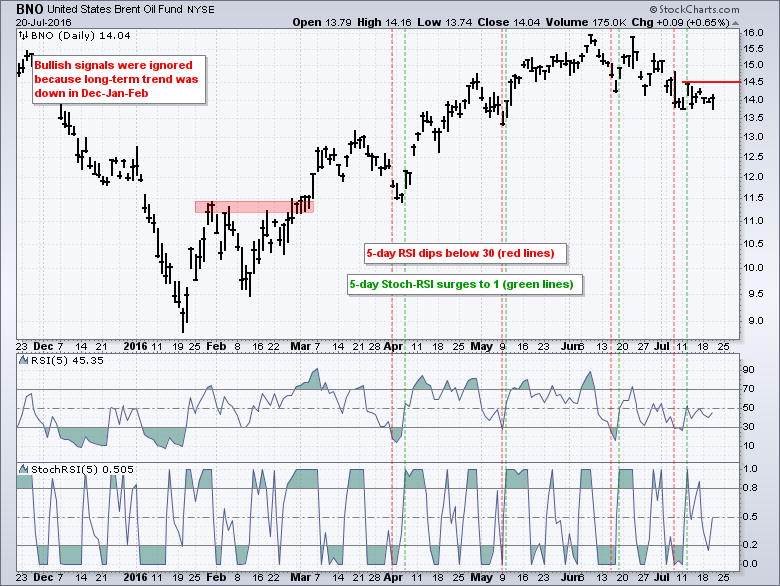
Using the same strategy as above, the USO Oil Fund (USO) and the US Brent Oil ETF (BNO) triggered bullish signals last week. Both have fallen back the last few days and StochRSI moved back below .20. Look for another surge to 1 to trigger a second bullish signal.
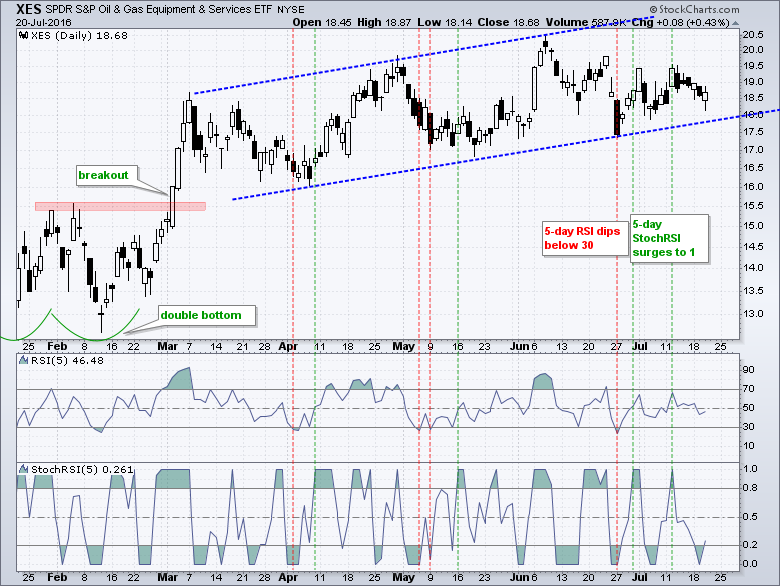
5-day RSI for the Oil & Gas Equip & Services SPDR (XES) dipped below 30 in late June and 5-day StochRSI surged to 1 twice over the last few weeks. The ETF remains with an active bullish signal, but StochRSI fell back below .20 this week. Thus, another surge to 1 would trigger the third bullish signal. I imagine XES is stalling because oil remains in a correction. Note that SLB reports earnings today.
Scan Code for RSI-StochRSI Strategy
Users can copy the scan code below and paste it into the advance scan workbench to run the RSI-StochRSI strategy. The first line covers stocks in the S&P 500. Chartists can activate that line by removing the two forward slashes // at the beginning. You can change the S&P 500 to the S&P MidCap 400 [group is SP400] or S&P Small-Cap 600 [group is SP600]. The StochRSI portion is set to trigger on a cross above .80 for a little more flexibility.
// [group is SP500] // ignores the phrases preceded by forward slashes
[group is ETFNOUI] // is a plain ETF (no ultra or inverse ETFs
and [SMA(200,volume) > 100000] // average volume is greater than 100,000 sharesAND [SMA(5,Close) > SMA(200,Close)] // 5-day SMA is above 200-day SMA (uptrend)
AND [Min(10,RSI(5)) < 30] // minimum value of 5-day RSI is below 30 over last 10 days
AND [Stoch RSI(5) x .80] // 5-day StochRSI crossed above .80
Remember, this is a short-term mean-reversion strategy designed to identify pullbacks within a bigger uptrend. It is quite an active strategy and chartists must think hard about their exit strategy. Entries are easy. Exits are quite the challenge.
Emerging and Latin American Markets Turn Up
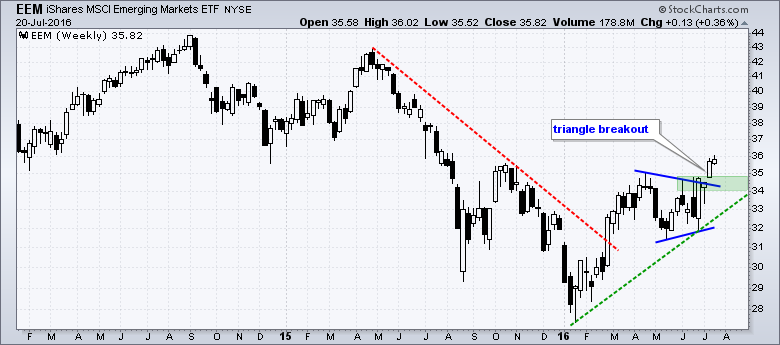
The four week rally and breakouts are not just confined to the US markets. The Emerging Markets ETF (EEM) broke triangle resistance and hit its highest level of the year. It is very close to a 52-week high as well. The green zone marks the first support area to watch on a pullback. This long-term chart is bullish and tells me to look for pullbacks on the daily chart. This means I will look for 5 or 10 period RSI to move below 30. Please do not ask which one works best. Test it for yourself!
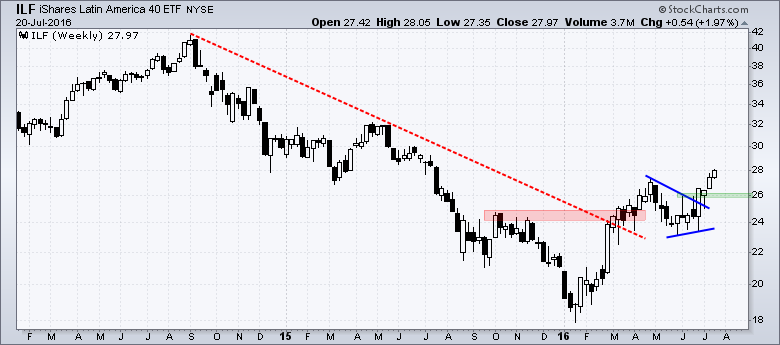
The Latin America 40 (ILF) broke a long trend line in March and formed a triangle into June. The ETF broke triangle resistance with a surge the last four weeks.
******************************************************
Measuring Risk On-Risk Off - Using charts to quantify stock, economic and credit risk.
PPO Trading Strategy - How to use 3 PPOs to develop a trend-reversion trading strategy.
Long-term Trend Indicators - Using the PPO, EMA Slope and CCI to determine the trend.
ETF Master ChartPack - 300+ ETFs organized in a Master ChartList and in individual groups.
Follow me on Twitter @arthurhill - Keep up with my 140 character commentaries.
****************************************
Thanks for tuning in and have a good day!
--Arthur Hill CMT
Plan your Trade and Trade your Plan
*****************************************


