SystemTrader // System Rules and Conditions // Why 5-day RSI? // Testing with S&P 500 Trend Condition // Surviving Some Bad Signals // Sensitivity Testing // Reducing the MDD with Another Trend Condition // Testing Each SPDR Individually // The Power of the Portfolio // Further Study //// ........
Today's Trading Strategy article will test different trading systems using 5-day RSI as the key indicator and the nine sector SPDRs. Mean reversion trading systems are basically the opposite of breakout systems. Instead of looking to buy on strength, mean reversion systems seek to buy on weakness and then sell into strength. These test results will give traders an idea of how the actual trading system would perform and this will help set expectations for future trades. For example, the average loss exceeds the average gain for this trading system, but the system is profitable overall and the percentage of winning trades is very high.
System Rules and Conditions
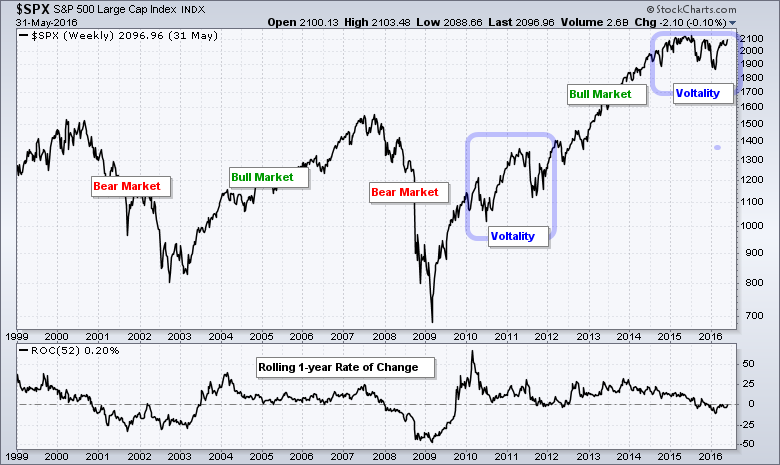
The backtest period extends from 1/1/1999 to 5/30/2016, which covers just over 17 years of data. It is a pretty good period because it includes two bear markets, two bull markets and two periods of volatility. In short, pretty much everything the market can throw at a trader is included.
The testing focuses on the nine sector SPDRs and uses dividend adjusted data. Only long positions were considered because the stock market has a long-term upward bias. Commissions were $10 per trade and each position accounted for 11.11% of the portfolio (100/9 = 11.11). The weightings were equal in case the portfolio had nine positions at one time, which was usually not the case. The signals are based on end-of-day (EOD) data and the buy-sell prices are based on the next day's open.
Why 5-day RSI?
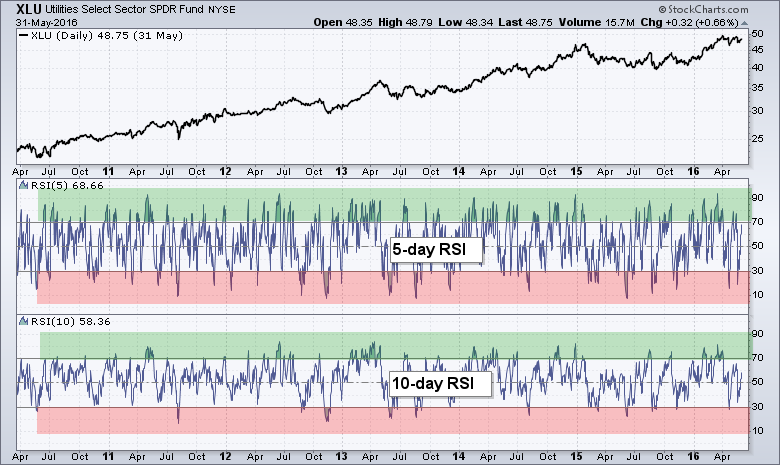
I decided to focus on 5-day RSI because it generates plenty of overbought and oversold signals. 10-day RSI also generates overbought and oversold signals, but far fewer than 5-day RSI. I also ran some tests with 10-day RSI and this indicator did not perform as well as 5-day RSI. The chart below shows XLU with 5-day RSI and 10-day RSI. Notice that 5-day RSI breaches the 30 and 70 levels more often than 10-day RSI.
Testing with S&P 500 Trend Condition
The base signal is to buy when RSI crosses below a specific level (30) and sell when RSI crosses above a specific level (70). This is a classic mean reversion system that seeks to buy when oversold (<30) and sell after a decent bounce (>70).
Note that all tests include a market condition using the S&P 500. Long positions are only considered when the 5-day SMA of the S&P 500 is above the 200-day SMA (bull market). The system does not take trades when the 5-day SMA is below the 200-day SMA (bear market). I tested these systems without the trend filter and the drawdowns were very high (>40%).
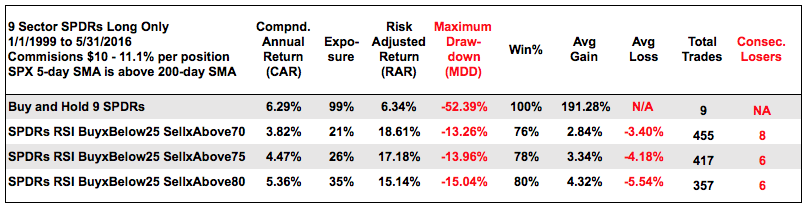
The table below shows the results for buy-and-hold and three systems. The first line shows buy-and-hold for the nine sectors. The Compound Annual Return is 6.29% for buy-and-hold and the Maximum Drawdown is a whopping 52.39%. It would be hard to sit through a 50+ percent portfolio loss.
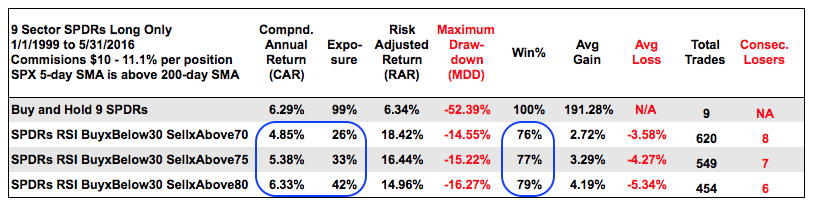
The next three lines show results for the 5-day RSI system: buy when RSI moves below 30 and sell when 5-day RSI moves above 70, 75 and 80. First, note that all three systems are profitable (CAR) and the MDD's are one third of buy-and-hold. Second, notice that the returns, exposure and winning percentage increase as the sell point for RSI increases (blue ovals). This suggests that it pays to allow the move to extend a little further.
The Compound Annual Return (CAR) may seem low, but we should be looking at the Risk-adjusted Return and consider exposure. Traders buying on a move below 30 and selling on a move above 80 were exposed to the market just 42% of the time. Money not exposed could have been put to use in another trading system.
The left side of the table shows the Average Gain, Average Loss and Total trades. The Average Loss was greater than the Average gain, but the high winning percent offset this negative. There were 541 trades on average and this equates to around 31 per year. And finally, note that traders would have had to endure 6 to 8 consecutive losses while trading these systems.
Surviving Some Bad Signals
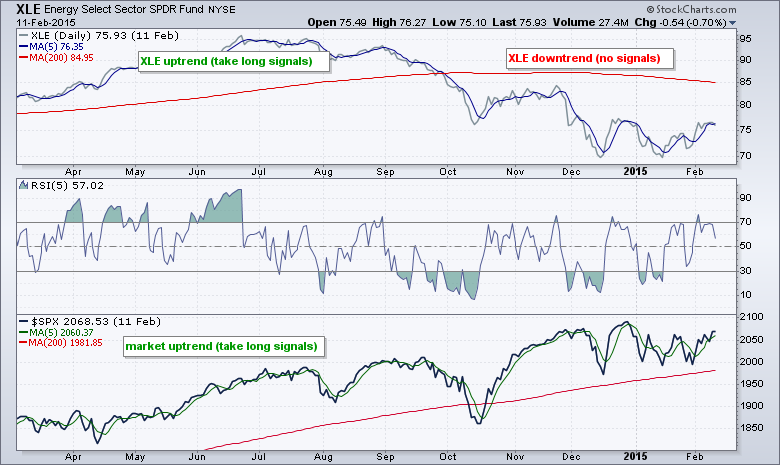
The overall results look pretty good, but some of the individual trades look down right horrible. Keep in mind that these tests are based on taking every signal and following the rules. No if's, and's or but's. The chart below shows the Industrials SPDR (XLI) with buy signals (green lines) and subsequent sell signals (red lines). The holding periods are usually quite short, but periods of market turmoil can make for some bad trades.
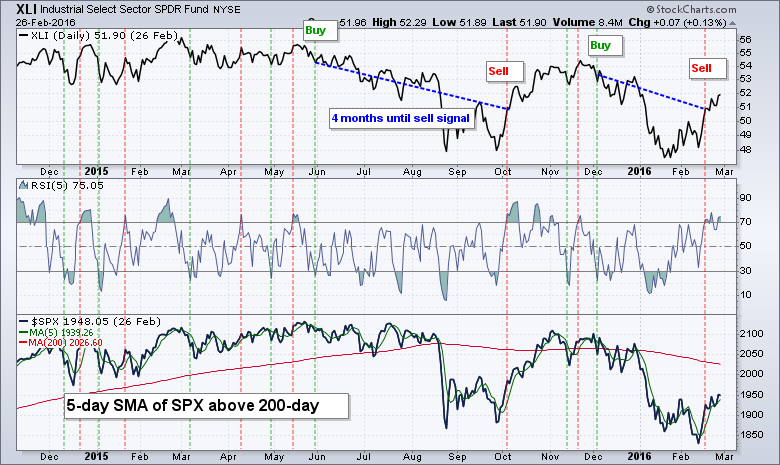
The blue lines mark two bad signals. There was a buy signal in late May and then a sharp decline. The subsequent sell signal came in early October, just as the market was taking off. Similarly, there was a buy signal in early December and a deep plunge into January. The subsequent sell occurred just as the market took off in mid February. These are the signals that test a trader's resolve to stick with the system through thick and thin.
Sensitivity Testing
I also did a little sensitivity analysis by decreasing the buy point for RSI to 25. Waiting for 5-day RSI to dip a little deeper did not improve the results. The Compound Annual Returns were lower in each case, but the Risk-adjusted Returns were higher in each case. This is because the exposure levels also dropped and there were fewer signals.
I also tested other combinations and the results were not as good. These combinations include buying on crosses below 20, 15 and 10 as well as selling on crosses above 80, 85 and 95. In most cases, the Compound Annual Return decreased substantially and the Maximum Drawdown increased. Not a good combination.
Reducing the MDD with Another Trend Condition
System traders are always looking for ways to reduce the Maximum Drawdown and reduce system risk. Simple trend conditions are often the best ways to reduce this drawdown. This means only buying when the trend is up and stay out with the trend is down. In addition to a market trend condition, I added a trend condition for the sector SPDR by requiring its 5-day SMA to be above its 200-day SMA.
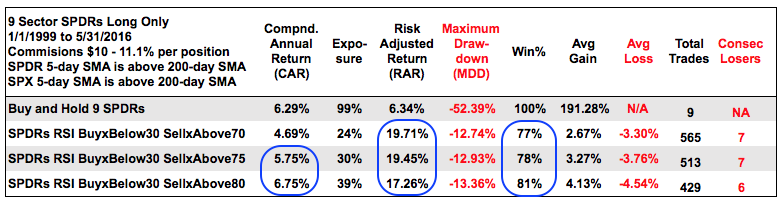
The table above summarizes the results for a 5-day RSI system with two trend conditions. Compared to the first table in this article, note that the Compound Annual Return is higher for two systems (RSI 30-75 and RSI 30-80), the Risk-adjusted Returns are higher for all three systems and the Win% is higher for all three. The Maximum Drawdowns also improved significantly. In short, adding this second trend condition to the SPDR itself improves system performance.
Testing Each SPDR Individually
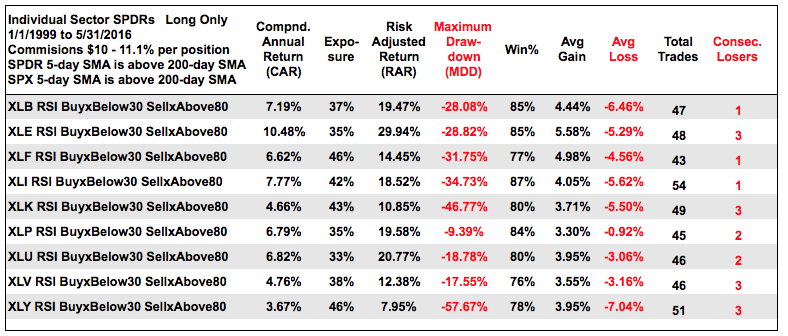
Now let's see how each SPDR performed with one set of trading rules. Here are the rules.
S&P 500: 5-day SMA is above 200-day SMA
SPDR: 5-day SMA is above 200-day SMA
Buy when 5-day RSI crosses below 30
Sell when 5-day RSI crosses above 80
The performance differences were quite big in some areas and relatively small in others. The table below shows the SPDRs sorted by symbol. XLE had the highest Compound Annual Return (10.48%) and XLY had the lowest (3.67%). The exposures ranged from 33% to 46%, which means the system traded one third to one half the time. Except for XLY, the Risk-adjusted Return were all double digits. The Maximum Drawdowns exceeded 30% for four SPDRs, but the winning percentage exceeded 75% for all.
Conclusions - The Power of the Portfolio
The power of the portfolio is clear when we compare individual performance with group performance. When used as a group, this 5-day RSI strategy has a nice Risk-adjusted Return and very tolerable drawdowns. Keep in mind that we are comparing Maximum Drawdowns against buy-and-hold. Also keep in mind that a mean reversion strategy can be part of an effort to diversify. The exposure for this systems is below 50% and traders can use other funds for a different system, such a trend following. I will start with trend following and momentum systems next week.
Further Study
The inspiration for this trading system came from the 2-period RSI system, which was developed by Larry Connors and Cesar Alvarez. You can read more about the 2-period RSI system in our ChartSchool article. You can also read more about trading systems and RSI(2) at AlvarezQuantTrading.com. The blog posts here deal with trailing stops, scaling and, of course, RSI(2).
These trading strategies were tested using Amibroker with the help of Cesar Alvarez of AlvarezQuantTrading.com. For more information about his testing and consulting services, click here.
******************************************************
Other Articles in the SystemTrader Series:
- Introduction to Key Performance Metrics - Quantifying the Golden Cross for the S&P 500
- Golden Cross and 5 Major Indexes - EMAs versus SMAs - Do Short Positions Add Value?
- Short-term Moving Average Crosses - Differences in Major Indexes - Do Trend Filters Work?
- MACD Crosses - Rules to Reduce Drawdowns and Increase Gains - Testing PPO Strategy
Follow me on Twitter @arthurhill - Keep up with my 140 character commentaries.
******************************************************
Thanks for tuning in and have a good day!
--Arthur Hill CMT
Plan your Trade and Trade your Plan
******************************************************


