A Stealth Correction ... Stocks to Watch on the Art's Charts ChartList ... An Impressive Parade of New Highs ... XBI Successfully Tests Breakout ... XOP is Outperforming XES ... Volatility Calendar ... //// ...
A Stealth Correction
A stock or ETF can correct with a pullback, a trading range or a combination of the two. Looking at the big three, I see a flat correction in QQQ and no correction in SPY or IWM because these two continue to work their way higher, but the pace is slower and this caused the momentum indicators to decline. A slow advance could be just a stealth correction because there is a certain amount of churning with the choppy advance. The SPY chart shows the linear regression within the Raff Regression Channel rising and the ETF breaking out of a small wedge. There was a small gap three days ago and this gap is holding. Short-term traders can watch 217 because a break below this level would negate this wedge breakout. Keep in mind that this wedge extends just eight days and it is a very short-term pattern, which means the chances of whipsaw are above average.
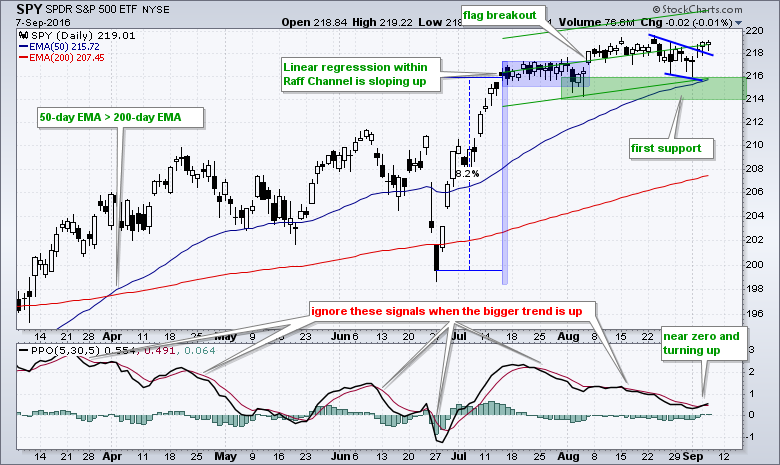
The indicator window shows the good ole PPO (5,30,5) turning up and moving above its signal line. The bigger trend has been up since March and this means I ignore short-term negatives, such as when the PPO moves below its signal line or below the zero line. The bigger uptrend holds more power than short-term pullbacks. I, therefore, only look for bullish signals because these are in harmony with the bigger uptrend. Not all bullish signals work, but this strategy gives me a framework to reduce irrelevant signals and focus on more meaningful signals. A meaningful signal occurs when the PPO (5,30,5) declines to the zero area and then turns up. This occurred on Tuesday and is now the active short-term signal. Caveat Emptor!
QQQ is close to a flag breakout and the PPO (5,30,5) turned up over the last few days. The flag lows mark support in the 116 area and broken resistance marks next support in the 111 area.

IWM extended its short-term uptrend and hit another 52-week high on Wednesday. IWM is clearly the strongest of the big three. The Chandelier Exit (22,2) rose to 122.83 and the first support level is set at 122.

Art's Charts ChartList
I updated the Art's Charts ChartList with some annotated charts. I am quite focused on the 7-10 YR T-Bond ETF (IEF) and 20+ YR T-Bond ETF (TLT) because the direction of their breaks could have ramifications beyond the bond market. I also included 11 stock setups (NUE, SCHN, TSO, GE, AMT, CCI, IBM, ORCL, RDWR, ICLR and BBBY).
An Impressive Parade of New Highs
I assume that a stock or ETF is in a clear uptrend when making a 52-week closing high. Moreover, anything hitting a 52-week high shows some serious chart strength and should be considered a leader. We can argue about short-term momentum and overbought conditions, but 52-week highs are unequivocally bullish for the long-term trend. The lists below shows the parade of ETFs recording 52-week highs on a closing basis over the last five days:
Major index ETFs:
Nasdaq 100 ETF (QQQ)
Russell 2000 iShares (IWM)
Russell MicroCap iShares (IWC)
S&P MidCap SPDR (MDY)
S&P SmallCap iShares (IJR)

Large-caps, small-caps, mid-caps and microcaps are the clear leaders here. This is impressive.
Sector ETFs:
Technology SPDR (XLK)
EW Technology ETF (RYT)
SmallCap Technology ETF (PSCT)
Finance SPDR (XLF)
EW Finance ETF (RYF)
SmallCap Financials ETF (PSCF)
SmallCap HealthCare ETF (PSCH)
SmallCap Industrials ETF (PSCI)
SmallCap Materials ETF (PSCM)
All three sector ETFs for technology and finance recorded 52-week highs over the last five days. This reflects broad strength throughout these sectors. Within the small-caps arena, healthcare, industrials and materials also recorded 52-week highs. Overall, five of the nine small-caps sector ETFs recording 52-week highs. This looks pretty bullish to me.
Furthermore, 14 of the 50 industry group ETFs that I track hit 52-week highs over the last five days. These include FDN, FAN HACK, IGN, IGV, KIE, SKYY, SOXX and XSD. There is a lot of representation from the technology sector in this group.
Overall, the parade of 52-week highs supports the bull market and shows us the strongest areas of the market.
XBI Successfully Tests Breakout
I previously identified short-term bearish pennants in the Biotech SPDR (XBI) and Biotech iShares (IBB). Both broke pennant support, but quickly rebounded the last few days and negated these breaks. As noted in Tuesday's webinar, the differing trend signals pose an analytical challenge for biotechs. XBI held its 200-day EMA on the pullback and the 50-day EMA is above the 200-day EMA (long-term uptrend). IBB fell back below its 200-day in late August and the 50-day remains below the 200-day (long-term downtrend). Even though these charts differ, it is clear that XBI is stronger than IBB. Notice that XBI held its breakout as broken resistance turned support (and held). A falling flag could now be forming and the surge off support is the first bullish indication. The indicator window shows XBI outperforming IBB since February because the price relative is rising (XBI:IBB ratio).


Look no further than the component weightings to find out why IBB is lagging XBI. IBB has 187 stocks and the top ten holdings account for a whopping 57% of the ETF. IBB is, therefore, dependent on these ten large-caps for performance. XBI, on the other hand, has 88 stocks and the holdigns are more equally weighted. Notice that the top ten stocks account for 26.6% of the ETF. This is a broad based biotech ETF and more representative of the industry group.
XOP is Outperforming XES
The Oil & Gas Exploration & Production SPDR (XOP) is outperforming the Oil & Gas Equipment & Services SPDR (XES). These two industry groups are from the same sector, but their charts look completely different. XOP features stocks involved in oil exploration, fracking and natural gas. XES focuses on stocks such as Baker Hughes (BHI), Nabors (NBR), Schlumberger (SLB) and Halliburton (HAL). The industries are related, but clearly different. The XOP chart shows a wedge breakout and bull flag near resistance. Also notice that XOP is outperforming RSP.


In contrast to XOP, XES is in a clear downtrend with a falling channel and the 50-day EMA is below the 200-day EMA. I am watching this channel closely because oil rebounded over the last few days and a breakout at 19 would be bullish. The indicator window shows the price relative trending lower as XES underperforms RSP.
Volatility Calendar
I added two more items that could affect the markets in the next two months. First, the Fed makes its policy statement on September 21st. Second, we could see some performance chasing after the elections because there is a lot of cash on the sidelines. This idea comes from Tom Lee of FundStrat Global Advisors. Keep in mind that the more people expect volatility, the less likely the market will oblige.
21-Sep (Wednesday): FOMC policy statement
26-Sep (Monday): First presidential debate
1-Oct (Saturday): Government debt ceiling deadline
4-Oct (Tuesday): Vice presidential debate
7-Oct (Friday): Employment report
9-Oct (Sunday): Second presidential debate
19-Oct (Wednesday): Third presidential debate
1-Nov (Tuesday): Six month cycle turns bullish
8-Nov (Tuesday): US election
9-Nov (Wednesday): Post election performance chasing? (via Tom Lee).
******************************************************
Measuring Risk On-Risk Off - Using charts to quantify stock, economic and credit risk.
PPO Trading Strategy - How to use 3 PPOs to develop a trend-reversion trading strategy.
Long-term Trend Indicators - Using the PPO, EMA Slope and CCI to determine the trend.
ETF Master ChartPack - 300+ ETFs organized in a Master ChartList and in individual groups.
Follow me on Twitter @arthurhill - Keep up with my 140 character commentaries.
****************************************
Thanks for tuning in and have a good day!
--Arthur Hill CMT
Plan your Trade and Trade your Plan
*****************************************


