Marking Pullback Support for the S&P 500 .... QQQ Stalls as Apple Lags the Fab Five .... Apple Falls on High Volume .... Alphabet and Microsoft Hold above Breakouts .... Amazon and Facebook are the Clear Leaders .... XLY Shows Internal Weakness .... Five Consumer Discretionary Stocks Showing Weakness .... Friday Food for Thought .... //// ....
Marking Pullback Support for the S&P 500
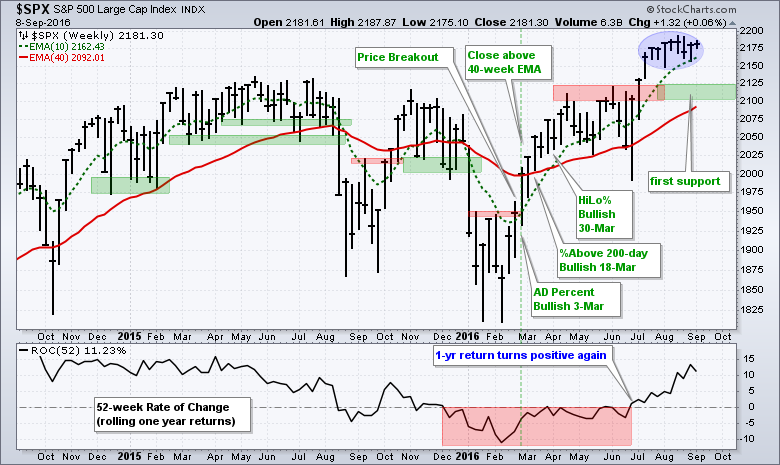
Stocks, as measured by the S&P 500 have gone nowhere the last seven weeks. The chart below shows the index breaking out in June and crossing the 2175 level in mid July. Notice that the prior bullish signals from March are labeled on the chart and this breakout was just a continuation of an already bullish situation. The consolidation over the last seven weeks reflects a stalemate between bulls and bears (blue area). While a break below the consolidation lows would be negative, it would not be enough to affect the long-term uptrend and bull market environment. In fact, we could even see a pullback to the 2100-2125 area and this would be a normal correction. At this point, I would view a pullback as an opportunity and not a threat. One pullback will eventually result in a bigger trend change, but I will not make that call until the evidence actually turns bearish.
QQQ Stalls as Apple Lags the Fab Five
Apple is still the king of the Nasdaq 100 ETF (QQQ) with a 10.37% weighting as of September 8th. The other four members of the "Fab Five" weigh as follows: Alphabet (9.01%), Microsoft (8.1%), Amazon (6.64%) and Facebook (5.41%). Together, these five account for 39.53% of QQQ. Four of the five are in clear uptrends and leading the market. Apple is the only one that did not clear its spring highs and can be considered the laggard of the group. Before looking at Apple, notice that QQQ has been in a tight consolidation the last five weeks. A break below the consolidation lows would argue for a pullback and we could then see a move back to broken resistance in the 111 area.

Apple Falls on High Volume
The next chart shows Apple failing to exceed the April highs, forming a lower high in early September and falling sharply on high volume Thursday. As I see it, there are two possibilities here. First, Apple is in a long-term downtrend because of a 52-week low in May and this short-term weakness means the downtrend is continuing. Second, Apple is in a trading range in 2016 and the failure near range resistance argues for a test of range support in the low 90s. Either way you slice it, it looks negative for Apple right now.

Alphabet and Microsoft Hold above Breakouts
Alphabet also fell back on Thursday, but volume was well below average. Overall, the stock broke out in July and hit a 52-week high in early August. A falling flag formed into early September and the stock broke out with a surge three days ago. This short-term breakout remains valid as long as GOOGL holds 790. Even though a move below 790 (or even 780) would be short-term negative, I would not turn long-term bearish on GOOGL and instead look for the next short-term bullish setup.

Microsoft broke out to new highs in July and remains above this breakout zone. Note that broken resistance turns support in the 55-56 area. The indicator windows show RSI(5) and StochRSI(10). A move below 30 in RSI signals an oversold condition and subsequent move above .80 in StochRSI shows a momentum pop (bullish signal). Note that I am using 10 periods instead of 5 periods for StochRSI. This is to decrease sensitivity and reduce the number of signals. Keep in mind that there is no such thing as the perfect setting and chartists should find the setting that works best for their particular trading style. MSFT currently has a bullish setup working because RSI(5) became oversold last week. A subsequent pop above .80 in StochRSI(10) would trigger a short-term bullish signal. You can read more about a short-term RSI strategy in this System Trader post.

Amazon and Facebook are the Clear Leaders
AMZN remains in a very strong, and stable, uptrend. As with the MSFT chart, the AMZN chart shows when RSI(5) becomes oversold (red lines) and StochRSI(10) pops above .80 (green lines). Notice that all these signals occurred when the 50-day EMA was above the 200-day EMA. In other words, bullish signals were only considered when the bigger trend was up. The last bullish signal was on 26-Aug.

Facebook is also in a strong uptrend and showing leadership with a 52-week high this week. Notice that Aroon Up and Aroon Down were both below 30 in late August and this signaled a consolidation. Up movement (Aroon Up) was weak and down movement (Aroon Down) were both weak. The subsequent breakout ended this stalemate.

XLY Shows Internal Weakness
While I remain bullish on the stock market overall, I am concerned with weakening breadth in the consumer discretionary sector because this is the most economically sensitive sector. The chart below shows the Consumer Discretionary SPDR (XLY) and EW Consumer Discretionary ETF (RCD) in the top windows. Both are above their rising 200-day EMAs and both hit 52-week highs in August. Even though they are flat since mid July, the overall trends are still up and we have yet to see breakdowns.

Signs of weakness appear when we look under the hood at the breadth indicators. The 10-day EMA for AD Percent has been negative since August 25th, which means declines have been outpacing advances recently. High-Low Percent dipped into negative territory twice this month, which means new 52-week lows are appearing. The %Above 200-day EMA is at 57%. Even though this is well above 50% and far from a bearish signal, it is the lowest reading of the nine sectors. The next lowest reading is 72%, for both the healthcare and consumer staples sectors. You can read more about these breadth indicators in this article.
Five Consumer Discretionary Stocks Showing Weakness
The next charts single out five key consumer discretionary stocks and recent breakdowns. Disney, 21st Century Fox and Nike are in long-term downtrends (50-day EMA below 200-day EMA). Home Depot and McDonalds are still in long-term uptrends, but they look vulnerable on the price charts. Disney most recently broke triangle support in late August and has been underperforming SPY the entire year.

Home Depot surged in July, weakened in August and then plunged the last three days. What looked like a normal pullback is now looking potentially worse. The bigger trend remains up, but the stock shows relative weakness since May.

McDonalds has been all over the place since May, but a clear downtrend has emerged with the falling channel. I would mark resistance at 120 and stay bearish until a break above this level. The indicator window shows MCD underperforming SPY since May.

21st Century Fox broke down in June with a gap and has underperformed SPY since late April.

Nike reversed at the 61.8% retracement in late August and broke the wedge trend line with a sharp decline on Thursday. The 50-day EMA is below the 200-day EMA and this looks like a continuation of the bigger downtrend.

Friday Food for Thought (and ChartCon)
I came across some interesting reads this week and thought I would share them. I do not want to become an aggregator but will share interesting reads as I come across them. Also note that the System Trader articles will resume in early October, just after ChartCon, where I will unveil a momentum-trend strategy for trading stocks in the S&P 1500. Click here to register.
Trend Following Works Weakest After Crises (Larry Swedroe - ETF.com)
Mark Hutchinson and John O’Brien contribute to the body of literature on time-series momentum through their 2014 study, “Is This Time Different? Trend Following and Financial Crises.” Using almost a century of data on trend-following, they investigated what happened to the performance of trend-following subsequent to the U.S. subprime and eurozone crises.
Understanding VIX ETFs: Careful What You Wish For (Dave Nadig - ETF.com)
The side effect of this contango is that any long-term investment in a VIX futures-based product ends up having enormous difficulties.
Have You Stress-Tested Your Portfolio Strategy? (James Picerno - CaptialSpeculator.com)
As a simple example, let’s review the results for a widely respected tactical asset allocation strategy that was originally outlined by Meb Faber in “A Quantitative Approach to Tactical Asset Allocation.” ... But let’s take this up a notch and run a Monte Carlo analysis on the Faber strategy.
Risk Parity isn't the Problem, it's the Solution (GestaltU.com)
Risk parity is characterized by three primary features. First of all, Risk Parity implementations almost always invest in a diverse basket of asset classes which react in different ways to various economic environments. That means they are more than just traditional portfolios of stocks and bonds. Rather, they include assets like commodities and gold, inflation protected securities, assets denominated in a wide variety of currencies, and more obscure assets like emerging market bonds. So it is incorrect to state that Risk Parity implementations will react exclusively to changes in risk and correlations in stocks and bonds.
******************************************************
Measuring Risk On-Risk Off - Using charts to quantify stock, economic and credit risk.
PPO Trading Strategy - How to use 3 PPOs to develop a trend-reversion trading strategy.
Long-term Trend Indicators - Using the PPO, EMA Slope and CCI to determine the trend.
ETF Master ChartPack - 300+ ETFs organized in a Master ChartList and in individual groups.
Follow me on Twitter @arthurhill - Keep up with my 140 character commentaries.
****************************************
Thanks for tuning in and have a good day!
--Arthur Hill CMT
Plan your Trade and Trade your Plan
*****************************************


