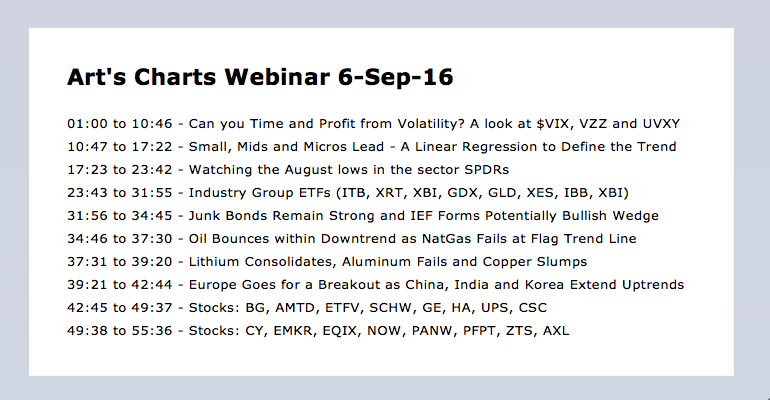
 Click here for Webinar recording .... Linear Regression Defines the Trend .... Small, Mid and Micro Lead the Charge .... IWM Works its Way Higher .... The Volatility Calendar .... Is it Possible to Profit from Volatility? .... Webinar Preview .... //// ...
Linear Regression Defines the Trend
The S&P 500 SPDR (SPY) remains with a slow and steady uptrend since mid July. An uptrend for the market benchmark means the short-term environment for stocks is positive (bullish). As noted in detail on Friday, the long-term environment is also bullish and I see no reason to question the bigger uptrend right now. Short-term, the green lines mark a Raff Regression Channel and the middle line is a linear regression that extends the length of this slow advance. The linear regression is slowing up and this means the overall trend remains up. The August lows and rising 50-day SMA mark support in the 214-216 zone. While a break below 214 would be negative, it would still be considered a pullback within a bigger uptrend. In other words, I would not turn that bearish on a close below 214. The indicator window shows the PPO (5,30,5) at an interesting juncture because it pulled back to the .40 area (near zero). An upturn and signal line crossover would suggest that momentum is picking up again.

The Nasdaq 100 ETF (QQQ) flattened out over the last four weeks and remains within a tight range that looks like a flat flag. An upside breakout at 118 would signal a continuation higher. The 5-Aug gap and August lows mark the first support level to watch in the 116 area. Further down, broken resistance marks second support in the 110-112 area.

Small, Mid and Micro Lead the Charge
Four index ETFs finished near their highs for the week/month and recorded 52-week highs on Friday. They were the Russell 2000 iShares (IWM), the S&P SmallCap iShares (IJR), the S&P MidCap SPDR (MDY) and the Russell MicroCap iShares (IWC). Small-caps, mid-caps and micro-caps are leading the market right now and this shows a healthy appetite for risk. Chart strength in these four can be attributed to strength in the finance sector. Note that financials account for 15% of MDY, 16.33% of IJR, 24.13% of IWC and 17.57% of IWM. Notice that the weighting in IWM dropped because REITs were removed from the finance sector. I suspect the same will happen with IWC in the near future. In any case, the six month PerfChart shows these four winning the Rate-of-Change battle with the biggest percentage gains.

IWM Works its Way Higher
The chart below shows IWM with a Raff Regression Channel. Notice that the linear regression (middle line) for IWM has a steeper slope than the linear regression for SPY. This reflects a steeper advance and stronger uptrend. The late August lows and Chandelier Exit mark a watch level around 122. I am not calling this "support" because I think it is just a level to watch. If broken, we may then see a short-term pullback.

The Volatility Calendar
There is certainly a lot of chatter regarding volatility and the next two months. September and October have reputations as volatile months. These two months also have reputations for stock market bottoms and the bullish six month cycle begins in November. Of course, the bearish six month cycle runs from May to October and the S&P 500 is currently up 5% since May 1st. Personally, I would pay more attention to price action than the six month cycle. In particular, just watch the 50-day EMA and 200-day EMA for the S&P 500. Returning to the volatility argument, the list below shows some events that could affect the stock market.
- 26-Sep (Monday): First presidential debate
- 1-Oct (Saturday): Government funding deadline
- 4-Oct (Tuesday): Vice presidential debate
- 7-Oct (Friday): Employment report
- 9-Oct (Sunday): Second presidential debate
- 19-Oct (Wednesday): Third presidential debate
- 1-Nov (Tuesday): Six month cycle turns bullish
- 8-Nov (Tuesday): US election
In particular, I see five events within a two week period from September 26th (Monday) until 10-October (Monday). This may just be the sweet spot for volatility.
Is it Possible to Profit from Volatility?
Anticipating volatility is one thing. Playing and profiting from volatility are very different things. The chart below shows the S&P 500 Volatility Index ($VIX) in the top window and the S&P 500 in the bottom window. Personally, I do not think the VIX adds any value to broad market analysis because it is just a coincident indicator. It goes up when the S&P 500 declines and down when the S&P 500 advances. It can signal "complacency", but the indicator can remain at "complacent" levels during an uptrend. Similar, it can break out to the upside during market declines, but suddenly fall back to its range as market turmoil subsides.

Making money on the S&P 500 Volatility Index ($VIX) looks simple enough. Just buy near 15 and wait for a pop to sell near 25. While it looks good in theory, the VIX ETFs are terrible trackers with a downward bias. The next chart shows the iPath S&P 500 VIX ETN (VXX) falling even as $VIX was flat in April-May and again in July-August. VXX is based on futures contracts that need to be rolled over and this creates the tracking error.

It gets even worse when leveraged is used. The next chart shows the ProShares Ultra VIX Futures ETF (UVXY) falling even more when $VIX is flat.

While there is a good chance we will see some above average volatility at some point in the next two months, timing it is the key and trading VIX ETFs is very tricky. The iPath S&P 500 VIX ETN (VXX) and ProShares Ultra VIX Futures ETF (UVXY) are short-term options, but holding more than two weeks can be very dangerous because the short-term swings are large.
The chart below shows UVXY with the 10-day Rate-of-Change. UVXY was up more than 20% on several occasions in November, December and January. It was also up double digits in June (just before BREXIT). In between these big surges, UVXY was down 20+ percent dozens of times from March to May and July to August. Trading looks very tricky because the ETF can surge in a short period of time and give back any profits just as fast. This is clearly a very short-term trading vehicle that requires a close watch. The blue dashed line marks the Brexit vote. UVXY surged around 50% in three days and then fell over 40% the next five days.

******************************************************
Measuring Risk On-Risk Off - Using charts to quantify stock, economic and credit risk.
PPO Trading Strategy - How to use 3 PPOs to develop a trend-reversion trading strategy.
Long-term Trend Indicators - Using the PPO, EMA Slope and CCI to determine the trend.
ETF Master ChartPack - 300+ ETFs organized in a Master ChartList and in individual groups.
Follow me on Twitter @arthurhill - Keep up with my 140 character commentaries.
****************************************
Thanks for tuning in and have a good day!
--Arthur Hill CMT
Plan your Trade and Trade your Plan
*****************************************


