Finance and Tech Power S&P 500 .... Broad Market Stalls .... QQQ and IWM Maintain Upward Drift .... XLI and XLB Bounce with Higher Lows .... XLE Holds Uptrend as XES Challenges Resistance .... Metals & Mining SPDR Extends Breakout .... Art's Charts ChartList Update .... //// ....
Finance and Tech Power S&P 500
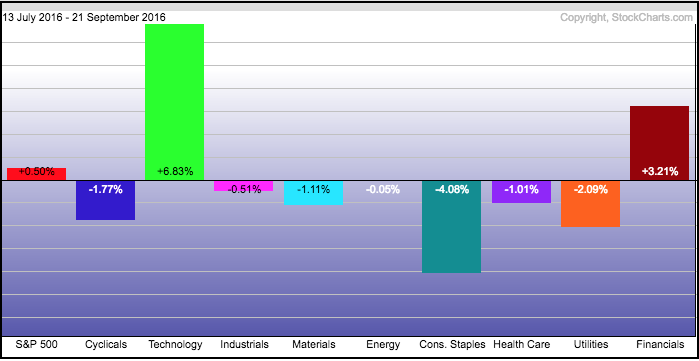
There are clearly some crosscurrents at work in the broader market, but the weight of the evidence is bullish and the long-term trend remains up for the S&P 500 SPDR (SPY). I have yet to get bearish signals on breadth and the 50-day EMA remains above the 200-day EMA. We can see these crosscurrents at work since mid July because SPY has gone nowhere the last two months. Before looking at the SPY chart, I will show the sector PerfChart since mid July. Notice that the Technology SPDR (XLK) and Finance SPDR (XLF) are the only two sector showing a gain. These two are the leaders right now. Even though the other seven sectors are down, the Industrials SPDR (XLI) Materials SPDR (XLB), HealthCare SPDR (XLV) and Energy SPDR (XLE) are modestly lower and not enough for serious concern.
Broad Market Stalls
The chart below show the ETF surging from late June to early July and then moved into a broadening consolidation. This consolidation started out with a narrow range and then turned volatile in September. Notice that the ETF has crossed the 215 several times and recently moved above this level again this week. The swing within the consolidation is up and I would mark short-term support with Tuesday's low. While a break below this level would be short-term negative, I think it would lead to the next bullish setup. For example, a move to the 210 zone would likely create a short-term oversold condition and this could provide an opportunity to partake in the bigger uptrend at lower prices.

QQQ and IWM Maintain Upward Drift
In contrast to SPY, the Nasdaq 100 ETF (QQQ) and Russell 2000 iShares (IWM) hit new highs last week. These highs reflect leadership in large-cap techs and small-caps, and also point to a strong risk appetite in the stock market. Also note that the technology sector features prominently in QQQ and the financial services sector accounts for around 25% of IWM. The charts below shows IWM and QQQ with Tuesday's lows marking first support and the mid September low marking long-term support. Notice that the PPO (5,30,5) is rising for both ETFs. Short-term support breaks and a bearish signal line cross in the PPO would suggest a pullback. As with SPY, I would not get too bearish because the bigger trend is up and a pullback would present an opportunity.


XLI and XLB Bounce with Higher Lows
The Industrials SPDR (XLI) and the Materials SPDR (XLB) are not in the prettiest uptrends, but both held above their Brexit lows and turned up over the last two weeks. I am electing to draw through the Brexit lows in late June and draw rising channels extending back to April, which represent uptrends over the last six months. XLI and XLB pulled back in early September, held above their Brexit lows and bounced. This looks like an upturn within a rising channel. The indicator window shows the PPO (5,30,5) turning up as upside momentum improves.


XLE Holds Uptrend as XES Challenges Resistance
The surge in oil dominated the news on Wednesday as crude surged some 5% on the heels of an OPEC quota decision. I covered oil on Tuesday and would like to see a follow through breakout at 51. The bottom window on the chart below shows December Crude (^CLZ16) holding support at 44 and surging within the triangle. A follow through move above 51 would break triangle resistance and this would be quite bullish for oil. The top window shows the USO Oil Fund (USO) with the 50-day EMA still below the 200-day EMA.

The Energy SPDR (XLE) chart looks similar to the XLI and XLB charts. Notice that XLE remains within a rising channel and the ETF reversed right near the lower trend line. The reversal over the last four days forged a higher low to keep the rising channel in play. I will now raise support to 66, which is right near the rising 200-day EMA.

The Oil & Gas Equip & Services SPDR (XES) is showing signs of life with a breakout and relative strength. The chart shows XES breaking above the wedge trend line and exceeding its September high. The indicator window shows the XLE:XES ratio turning up over the last two weeks as XES outperforms XLE. While the surge in XES looks promising, keep in mind that the ETF is up around 9% this week and buying now would be chasing. It might be time to put XES on the bullish watch-list and look for RSI(5) to move below 30 for a mean reversion trade.

Metals & Mining SPDR Extends Breakout
The Metals & Mining SPDR (XME) seems to like what is happening in the oil market because it surged on Wednesday as well. The first chart shows XME with a higher low in mid September and a rising channel extending back to May. Notice that the ETF reversed near the 61.8% retracement in mid September. XME broke the August trend line last week, fall back for a few days and resumed this week. The indicator window shows the XME:SPY ratio turning up and XME starts to outperform again. Mining stocks led XME and I will feature AA, ATI, BHP, CAT, RIO and SCHN in the Art's Charts Chartlist today.

Art's Charts ChartList Update
My ChartList has been updated with 12 stock charts that warrant a watch. Several come from the materials sector. There are also some from the technology and healthcare sectors.
******************************************************
Measuring Risk On-Risk Off - Using charts to quantify stock, economic and credit risk.
PPO Trading Strategy - How to use 3 PPOs to develop a trend-reversion trading strategy.
Long-term Trend Indicators - Using the PPO, EMA Slope and CCI to determine the trend.
ETF Master ChartPack - 300+ ETFs organized in a Master ChartList and in individual groups.
Follow me on Twitter @arthurhill - Keep up with my 140 character commentaries.
****************************************
Thanks for tuning in and have a good day!
--Arthur Hill CMT
Plan your Trade and Trade your Plan
*****************************************


