Are US Stocks Affected by European Financials? .... Five Broad Market Risk Ratios .... Small-caps are Killing It .... Junk Bonds Show No Fear .... A Selling Climax for Deutsche Bank? .... Friday Food for Thought .... //// ....
Are US Stocks Affected by European Financials?
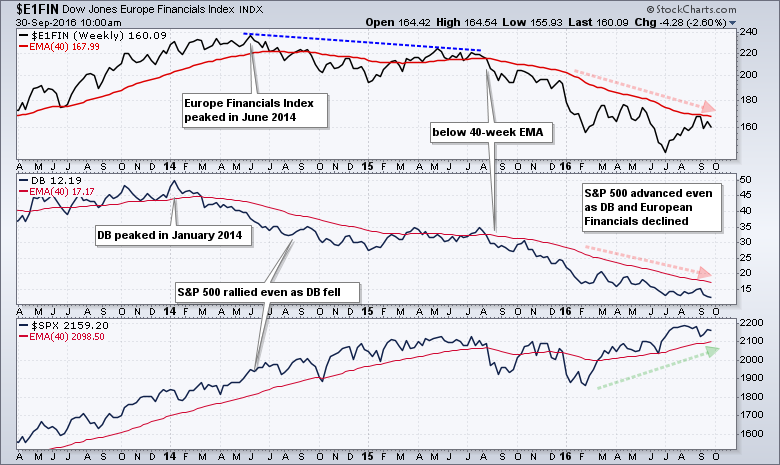
The Deutsche Bank woes are dominating the news right now and markets are adjusting to the potential fall out. This is certainly an issue for Deutsche Bank shareholders and possibly for European equities, especially the finance sector. The effect on US markets is still open for debate and this is a good time to check some key risk ratios. Before looking at these ratios, let's look at charts for Deutsche Bank (DB), the DJ European Finance Sector Index ($E1FN) and the S&P 500. Notice that DB peaked in January 2014 and the European Finance Sector peaked in June 2014. Despite weakness in these two, the S&P 500 rose throughout 2014 and into 2015. There was some positive correlation from August 2015 to February 2016 as all three declined. This ended in February as the S&P 500 embarked on an advance to new highs and the other two continued lower. The Deutsche Bank saga is interesting to follow, but the S&P 500 is its own beast and we should watch US market indicators for clues on US stocks.
Five Broad Market Risk Ratios
Chartists can use ratio charts to gauge the risk appetite for US stocks - a.k.a. the S&P 500. These ratio charts basically tell us if the market is in risk-ON mode or risk-OFF mode. Keep in mind that I am referring to the S&P 500 and the broader stock market, not individual sectors or industry groups. The next five charts show ratios as the 5-day EMAs (green) and 120-day EMAs (red). These EMAs provide an objective manner to measure risk. Risk is ON when the 5-day EMA is above the 120-day EMA. Risk is OFF when the 5-day EMA is below the 120-day EMA. We can also use basic peak-trough analysis to define the trend.
 The first two charts compare the stock market to the bond market. The SPY:IEF ratio shows the performance of SPY relative to the 7-10 Yr T-Bond ETF (IEF) and the SPY:VBMFX ratio shows performance relative to the Vanguard Total Bond Market Fund (VBMFX). The US market favors stocks (risk) over bonds (safety) when this ratio rises and favors safety when this ratio falls. The 5-day EMAs dipped below their 120-day EMAs in June as the market went to risk-off with the Brexit vote. This did not last long as both rebounded quite quickly. The 5-day EMAs have flattened in recent weeks, but remain above the 120-day EMAs and still favor risk-ON.

Small-caps are Killing It
The second chart pair shows relative performance for the S&P SmallCap iShares (IJR) and the Equal-Weight S&P 500 ETF (RSP). IJR represents small-caps and high beta stocks, while RSP represents the "average" stock in the S&P 500. The risk appetite is strong when small-caps and equal-weights outperform (risk-on). The 5-day EMA of the IJR:SPY ratio has been above the 120-day EMA since late May. This ratio is incredibly strong and this means small-caps are showing some serious relative strength.

The RSP:SPY ratio has flattened over the last five months, but remains in an uptrend overall. A move below .384 would break the 120-day EMA and signal a downturn.

Junk Bonds Show No Fear
The last ratio shows the performance of the High-Yield Bond SPDR (JNK) relative to the 7-10 YR T-Bond ETF (IEF). Like stocks, junk bonds are very sensitive to the economy and represent a risk asset. An uptrend in the JNK:IEF ratio shows a preference for risk (high yield) and this means risk-ON. A downtrend shows a preference for safety and this means risk-OFF. The JNK:IEF ratio is currently in a strong uptrend and showing no signs of weakness. There is even room for a pullback without breaking down.

All five ratios are in uptrends and this means the market is firmly in a risk-ON environment. I am using five ratios for a weight of the evidence approach to the markets. The stock market would move to risk-OFF if/when three of the five ratios break down (5-day EMAs move below 120-day EMAs). Even though the Deutsche Bank woes are a concern in Europe, the US stock market is doing just fine right now and I would not be concerned with the S&P 500 unless three of these ratios trigger risk-OFF signals.
A Selling Climax for Deutsche Bank?
Deutsche Bank (DB) has been all over the news lately and we are hearing comparisons to Lehman. I do not know if DB needs a bailout, if they will get a bail out or if they will fail. Nobody knows. Failure, of course, is the worst possible scenario, but there are two other scenarios. Frist, the bank may not need a bailout and could continue to muddle along. Second, the bank could obtain some sort of funding to see it through this period. Again, I do not know how this will unfold and I have not analyzed the bank's finances. I have, however, taken a look at the price chart and see a potential selling climax. The chart shows the US-traded ADR plunging below 12.5 on weekly volume that is more than double the levels seen in June - and there is still one more trading day left this week. This smacks of a panic or selling climax that could set up a low in the stock. A high volume move above 13 would spring a bear trap and suggest that the bank will not fail.

This play for a selling climax is clearly a bottom picking excercise and I am not a bottom picker. As with WorldCom, Enron, Lehman and MF Global, the problems did not appear overnight and all there in clear downtrends already. In other words, a simple trend-following strategy would have caused one to exit these stocks well before the bulk of their declines. The chart above shows the 10-week EMA moving below the 40-week EMA in August 2015 and the stock breaking wedge support later that month. DB was in a clear downtrend already and the new lows should not have come as a surprise.
Friday Food for Thought
Two Techniques to Beat the Market (spectator.co.uk)
There is a style of trading that has been successful for centuries but which remains off the radar of most investors, whether individuals or institutions. That it remains widely overlooked by the mainstream adds to its appeal today. Perhaps 99 per cent of fund managers attempt to predict the future — and most do a pretty poor job. But there is an intriguing 1 per cent who make no attempt to predict but merely respond to the price signals of the past. They are known as-systematic trend-followers.
Quant Who Coined Risk Parity Says Wall Street Has It Wrong
(Dani Burger, Bloomberg)
The (Risk Parity) strategy begins with the premise that standard portfolios are held hostage by their concentration of risky assets like stocks. Unless subdued, they can account for all of a manager’s gains or losses because they swing around so much. By balancing it all out and adding leverage, the influence of tamer assets increase and returns stabilize, the thinking goes.
Microsoft to Salesforce: Game on (BusinessInsider.com)
Salesforce may not be aware, but the deal has already been cleared to close in the United States, Canada, and Brazil. We’re committed to continuing to work to bring price competition to a CRM market in which Salesforce is the dominant participant charging customers higher prices today

******************************************************
Measuring Risk On-Risk Off - Using charts to quantify stock, economic and credit risk.
PPO Trading Strategy - How to use 3 PPOs to develop a trend-reversion trading strategy.
Long-term Trend Indicators - Using the PPO, EMA Slope and CCI to determine the trend.
ETF Master ChartPack - 300+ ETFs organized in a Master ChartList and in individual groups.
Follow me on Twitter @arthurhill - Keep up with my 140 character commentaries.
****************************************
Thanks for tuning in and have a good day!
--Arthur Hill CMT
Plan your Trade and Trade your Plan
*****************************************


