Year-to-date Performance for 3 Key Commodities .... Oil Remains Stuck in Downtrend .... Copper Consolidates with Downtrend .... Gold Stalls above Breakout Zone .... Charts to Watch - XLF, GOOGL, FDN and MSFT .... //// ....
Year-to-date Performance for 3 Key Commodities
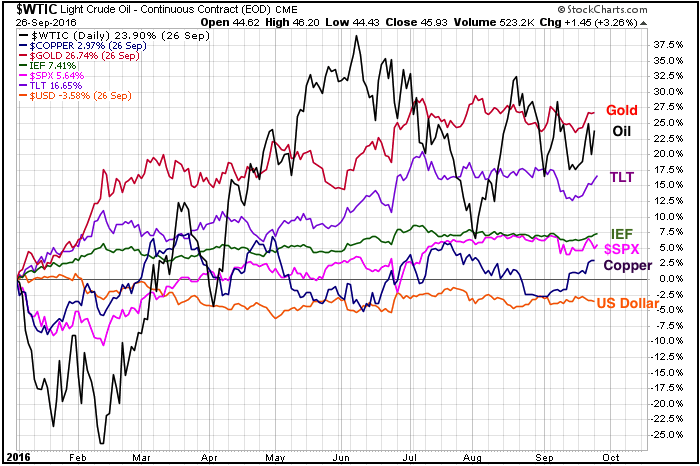
The oil, gold and copper charts could give us some insight into Treasury yields, future inflation and the economy. In general, upside breakouts in oil and copper would suggest that demand is picking up and this would be a positive sign for the economy. It could also point to an uptick in inflation. I am currently bearish on oil and copper, but have set chart levels that would turn me bullish. Breakouts in these key commodities could put upward pressure on interest rates and adversely affect Treasury bonds. The chart below shows year-to-date performance for gold, oil, copper, Treasury bond ETFs, the S&P 500 and the Dollar. The Dollar is the only one down year-to-date, while gold and oil are up the most. Note that Martin Pring has written about a possible uptick in inflation recently and Greg Schnell has been covering the commodity story. Here are my two cents.
Oil Remains Stuck in Downtrend
December Crude (^CLZ16), which is in the bottom window on the chart below, broke below 50 in August 2015 and is currently below 50 in September 2016. Even though oil surged some 50% from January to June, the advance formed a rising channel/wedge and looked like a counter-trend rally. This counter-trend rally ended with the channel/wedge break in July and this break remains the dominant chart feature right now. Also note that the 10-week EMAs (green) are below the 40-week EMAs for both the USO Oil Fund (USO) and December Crude.

It may appear that oil is bottoming because it remains above its January low. However, I think it is too early to take this consideration seriously, especially after the channel/wedge break. I am marking resistance at 51 and would not consider turning long-term bullish until oil closes above this level on the weekly chart. Such a move would negate the wedge/channel breaks and show enough buying pressure to take out the August high.
Copper Consolidates within Downtrend
Copper is a bit like oil in that the long-term trend remains down, but it could be forming a base this year. There is a fine line between a base and a consolidation within a downtrend. Chartists pretty much have to watch support and resistance levels for pattern resolution. The chart below shows the Copper ETN (JJC) and December Copper (^HGZ16) with big triangles since January. The noose is tightening as the range narrows and this means we are getting close to a break.

Gold Stalls above Breakout Zone
Gold is currently consolidating within an uptrend. Gold surged early in the year as the stock market plunged and then began to consolidate when the stock market bottomed in mid February. Gold got another surge in June and broke above its April high. This breakout is holding as gold consolidated with a falling channel/wedge (blue lines) over the last ten weeks. Overall, I view this channel/wedge as a corrective pattern within a bigger uptrend. This means an upside breakout is expected and such a move would signal a continuation of that trend. The broken resistance zone (blue) turns into the first support zone to watch. Failure to breakout and a close below this zone would be quite negative and call for a reassessment. At ChartCon, John Murphy noted a negative correlation between gold and the 10-year Treasury yield. Keep this in mind when watching gold. http://stockcharts.com/members/

Admittedly, there are some rather strange dynamics at work. If oil continues lower after its wedge/channel break and copper breaks triangle support, I would then expect the 10-year yield to fall and Treasury bonds to rise. A decline in Treasury yields would be bullish for gold because these two are negatively correlated. Conversely, upside breakouts in copper and oil would point to higher Treasury yields and this would be negative for gold.
Charts to Watch - XLF, GOOGL, FDN and MSFT
The Finance SPDR (XLF) formed a big piercing pattern near support on Tuesday.

Google (GOOGL) is holding its breakout as broken resistance turned into support and held.

Amazon, Google and Facebook powered the Internet ETF (FDN) to a new price high and a new relative high (FDN:SPY ratio).

Microsoft (MSFT) broke out and this breakout is holding. Notice how RSI became oversold at the end of August and there was a StochRSI pop on September 15th.

******************************************************
Measuring Risk On-Risk Off - Using charts to quantify stock, economic and credit risk.
PPO Trading Strategy - How to use 3 PPOs to develop a trend-reversion trading strategy.
Long-term Trend Indicators - Using the PPO, EMA Slope and CCI to determine the trend.
ETF Master ChartPack - 300+ ETFs organized in a Master ChartList and in individual groups.
Follow me on Twitter @arthurhill - Keep up with my 140 character commentaries.
****************************************
Thanks for tuning in and have a good day!
--Arthur Hill CMT
Plan your Trade and Trade your Plan
*****************************************


