 Webinar Video (here) -- Art's Charts ChartList (here)
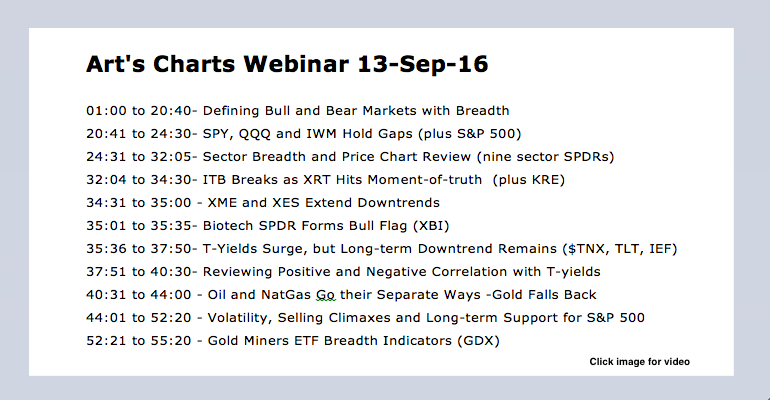
Gap and Volatility Hold .... Measuring Broad Market Breadth .... Using AD Percent for Early Warning .... New Highs Lag in S&P 500 .... Vast Majority of Stocks Still Trending Up .... Putting it All Together .... Discretionary and Staples Weigh on Sector Table .... Webinar Video .... //// ....
Gap and Volatility Hold
Short-term price action turned volatile the last three days with the S&P 500 plunging over 2% on Friday, rebounding 1.5% on Monday and then falling over 1% in early trading on Tuesday. The chart below shows the index not moving more than 1% for 42 days and then making its move with a gap and break below the August lows on Friday. This is short-term bearish and the next support level resides in the 2100-2120 area. Short-term volatility could continue for the next few weeks so I will take a step back and look at some broad market indicators today. The bigger threat is that we move from a bull market environment to a bear market environment. The breadth indicators suggest that we are still in a bull market environment and I will show the levels required to change that stance.

Measuring Broad Market Breadth
The breadth indicators for the S&P 1500 have been bullish since March and I will stay bullish until bearish signals materialize. As far as timeframe, I am talking the foreseeable future, which is just past my nose. All kidding aside, I view the long-term as anything longer than three months. The indicators are bullish until they aren't and it will take more than just a few days of selling pressure to turn them bearish. Note that these indicators did not turn bearish during the Brexit debacle.
The chart below shows the S&P 1500 index along with the 10-day EMA of S&P 1500 AD Percent ($SUPADP), S&P 1500 High-Low Percent ($SUPHLP) and the Percentage of S&P 1500 stocks above the 200-day EMA. The last indicator is based on a user-defined index. These indicators and their signals are detailed in this System Trader article (here).
To recap: the 10-day EMA of AD Percent turns bullish with a move above +30% and bearish with a move below -30%, High-Low Percent turns bullish with a move above +10% and bearish with a move below -10% and the %Above 200-day EMA turns bullish with a move above 60% and bearish with a move below 40%. AD Percent is the most sensitive of the group and usually the first to signal. The chart below shows bullish and bearish signals in AD Percent with the green and red lines.

Notice that AD Percent turned bullish when the index broke out in early October and early March. Similarly, AD Percent turned bearish when the index broke down in January. High-Low Percent and the %Above 200-day turned bearish the third week of August and did not reverse these bearish signals until March 31st. These two indicators are less sensitive and act like trend-following indicators (lag). AD Percent, on the other hand, acts as an early warning indicator that shows sudden, and dramatic, shifts in breadth. At this point, the 10-day EMA of AD Percent has not been below -20% since January and this shows limited selling pressure so far. A break below -30% would show a dramatic expansion of selling pressure and provide the first bearish indication of significance.
Using AD Percent to Identify Dramatic Shifts
I use the S&P 1500 for broad market assessments, but chartists can also breakdown the individual indicators by index for further clues on market dynamics. The chart below shows the 10-day EMA of AD Percent for the S&P 1500, S&P 500, S&P MidCap 400 and S&P Small-Cap 600. Sometimes we get an early warning signal from one of the individual index indicators. So far I have yet to get a bearish signal from any of the index indicators and this means all remain in bull mode. I set the threshold at -30% to weed out modest shifts in breadth and focus on significant shifts.

New Highs Lag in S&P 500
The High-Low Percent indicators turned negative for the S&P 1500, S&P 500 and S&P MidCap 400 because there were more new lows than new highs on Monday. Note that these negative readings were less than 1% and barely visible on the chart. S&P 600 High-Low% ($SMLHLP) managed to stay positive. I also noticed that S&P 500 High-Low% ($SPXHLP) did not exceed +10% in August or September and this makes the S&P 500 a laggard. There appears to be some weakness in large-caps because fewer stocks made new highs in August. This is a sign of "less strength", but we have yet to get any bearish signals with moves below -10%. Again, I am weeding out the whipsaw signals and focusing on significant changes in breadth.

Vast Majority of Stocks Still Trending Up
The next chart shows the Percentage of Stocks above the 200-day EMA for the S&P 1500, S&P 500, S&P MidCap 400 and S&P Small-Cap 600. Using the data from the latter three, I created a user-defined index for S&P 1500 %Above 200-day EMA. Notice that this indicator turned bearish on August 21st and affirmed this bearish signal in early January. The bearish signal was finally reversed with a bullish signal on March 31st. Over 70% of stocks in the S&P 1500 are currently above their 200-day EMA and I am not seeing any deterioration in the individual indexes.

Putting it All Together
The table below shows the individual indexes, the indicators and the signal dates. All are green, which means all indicators are currently bullish. The column on the right shows when at least three of the four indicators turned bullish (net bullish). The S&P 500 and S&P MidCap 400 have been net bullish since mid March. The S&P 1500 joined in late March and the S&P Small-Cap 600 turned bullish in mid April. Aggressive traders could have picked up on the dramatic surge in breadth as the 10-day EMAs for AD Percent turned bullish in early March. As noted above, the 10-day EMA of AD Percent will likely be the first indicator to turn bearish so keep an eye on this one.

Discretionary and Staples Weigh on Sector Table
The indicators above can be applied to the nine sectors and the table below shows the current status. All nine sectors are net bullish and all but two indicators are bullish. XLY %Above 200-day EMA (!GT200XLY) dipped below 40% on September 9th to turn bearish and the 10-day EMA of XLP AD Percent ($XLPADP) moved below -30% to turn bearish on the same day. It is a bit strange to see two diametrically opposed sectors with the only bearish signals and most relative weakness. In any case, these bearish signals are clearly the exception in the market and the sector indicators clearly favor the bulls. I would not become concerned with broad market health until at least a third of this table turns red.

******************************************************
Measuring Risk On-Risk Off - Using charts to quantify stock, economic and credit risk.
PPO Trading Strategy - How to use 3 PPOs to develop a trend-reversion trading strategy.
Long-term Trend Indicators - Using the PPO, EMA Slope and CCI to determine the trend.
ETF Master ChartPack - 300+ ETFs organized in a Master ChartList and in individual groups.
Follow me on Twitter @arthurhill - Keep up with my 140 character commentaries.
****************************************
Thanks for tuning in and have a good day!
--Arthur Hill CMT
Plan your Trade and Trade your Plan
*****************************************


