Revisiting the 2013 Taper Tantrum .... Stocks Entitled to a Correction .... Oversold within an Uptrend .... Watching Inside Days in XLY and XLI .... XLE and XES Go their Separate Ways .... Exxon and Chevron Lead XLE Lower .... Radware Breaks Out as Icon Firms .... //// ....
Revisiting the 2013 Taper Tantrum
Many analysts are comparing the current market decline with the taper tantrum so I thought it would be a good time to looks at the key charts then and now. The first chart shows the S&P 500 and the 30-yr T-Yield ($UST30Y) in 2013. The taper tantrum occurred on May 21st when Fed Chairman Bernanke suggested a "tapering" of monetary policy. The 30-yr yield has already bounced the first three weeks of May and extended its gains into August. Overall, the yield moved from 2.8% to 3.8%, which is a HUGE move.
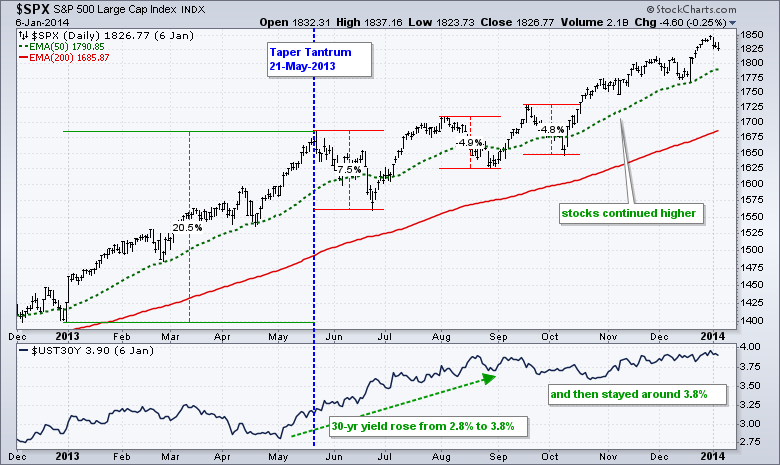
The S&P 500 fell sharply from mid May to late June with a 7.5% decline from high to low. This decline started right when Bernanke suggested tapering. The decline broke the 50-day EMA and may have seemed drastic at the time, but the index was clearly entitled to a pullback after a 20% advance. Notice that the index did not break the April lows and did not test the 200-day EMA. This "tantrum" turned out to be a fairly normal correction as the S&P 500 bottomed in late June and resumed its zigzag advance the rest of the year. The 30-yr yield held near 3.8%, but this DID NOT deter the S&P 500. Moral of the story: Correlation is not the same as causation. Watch the S&P 500 if you are interested in stocks and the 30-yr T-yield if you are interested in bonds.
Stocks Entitled to a Correction
The next chart shows the S&P 500 over the past year with the 30-yr T-Yield. First, notice that the index advanced some 20% from mid February to mid August and was entitled to a correction. Second, the current decline has extended just 3.6% from high to low. It is just a blip in the uptrend at this stage. A "hair raising" 7.5% decline would extend to the 2030 area and test the April-June lows (sans the Brexit spike). The 30-yr Yield ($UST30) surged above 2.4% this month and gave the market the excuse needed to correct. However, as shown with the 2013 chart, correlation is not the same as causation because stocks rose even as the 30-yr yield rose. I would, therefore, not get too caught up in the argument that rising yields are bearish for stocks. Watch the stock market for clues on the stock market!

Oversold within an Uptrend
Let's forget about support, resistance, breakouts, breakdowns, gaps and other chart stuff for a moment and look at two things: long-term trend and short-term conditions. The theory is that short-term oversold conditions provide opportunities when the bigger trend is up. The bigger trend is clearly up because the S&P 500 hit a 52-week high a few weeks ago and the 50-day EMA is way above the 200-day EMA. Short-term, several momentum oscillators became oversold on Friday as (RSI(10) and RSI(5) dipped below 30 and CCI(20) hit its lowest level since August 24th. The chart below shows RSI(5) doing double dips in May and June. Actually it was a triple dip in June. I do not know if we will see a double dip, single dip or failed signal this time around - nobody knows. However, the short-term bullish setup is here and the bigger uptrend is still the dominant force at work.

Chartists interested in short-term price patterns should note that two inside days formed recently (blue oval). There was a long white candlestick on Monday and the range of the next two candlesticks is completely within the range of the long white candlestick. This shows indecision that could set up the next move. I favor the upside because the long-term trend is up and the index was short-term oversold. A move below 212 would break Monday's low and prove me wrong. It would also suggest that the second shoe is dropping.
Watching Inside Days in XLY and XLI
Will the market bounce and continue its uptrend from here or will the second shoe drop and extend the correction? This is the big question right now. In addition to SPY, the Industrials SPDR (XLI) and Consumer Discretionary SPDR (XLY) also formed inside days and firmed on Tuesday-Wednesday. The long-term trends are up for both ETFs because the 50-day EMAs are above the 200-day EMAs. Short-term, both fell sharply on Friday and then stalled for two days. Monday's low marks the first support level to watch. A break below this level would suggest that the second shoe is dropping for these sectors and this would weigh on the broader market.


XLE and XES Go their Separate Ways
The Energy SPDR (XLE) fell sharply the last four days, but remains in an uptrend overall and continues to outperform the Oil & Gas Equip & Services SPDR (XES). The chart shows XLE within a rising channel since May and I am marking key support in the 65 area. A close below the early August low would clearly break channel support and reverse this uptrend. The indicator window shows the XLE:XES ratio rising from early June to mid September. This means XLE is clearly outperforming XES. Put another way, XES is clearly underperforming XLE.

Exxon and Chevron Lead XLE Lower
Before looking at XES, I would like to point out recent breakdowns in ExxonMobil (XOM) and Chevron (CVX). Together, these two stocks account for 32% of the XLE. XOM plunged in July, formed a rising wedge into early September and broke wedge support with a sharp decline the last four days. Also notice that MACD is already in negative territory and recently moved below its signal line. The second chart shows CVX with a similar pattern and breakdown.


The Oil & Gas Equip & Services SPDR (XES) should be a concern because it is underperforming XLE and remains in a downtrend. This could also be negative for oil. XES sports a series of lower highs since June and is seriously underperforming XLE. A break above 18.5 is needed to reverse this downtrend.

Radware Breaks Out as Icon Firms
Radware (RDWR) continues to act well and show relative strength in September. On the price chart, stock has a double bottom or rounding bottom in place from February to July. The stock broke flag resistance with a surge in early August and then formed a falling flag into early September. RDWR did not breakdown with the rest of the market last week and is already trading above flag resistance.

I am still watching Icon PLC (ICLR) as the stock firms within a falling channel. This channel looks like a correction within an uptrend and a breakout at 78 would be bullish. Chartists can also watch MACD for an upturn and signal line crossover for a bullish momentum signal. Charting Tip: Check the "full quote" box in the Chart Attributes section to see the detailed information at the top.

******************************************************
Measuring Risk On-Risk Off - Using charts to quantify stock, economic and credit risk.
PPO Trading Strategy - How to use 3 PPOs to develop a trend-reversion trading strategy.
Long-term Trend Indicators - Using the PPO, EMA Slope and CCI to determine the trend.
ETF Master ChartPack - 300+ ETFs organized in a Master ChartList and in individual groups.
Follow me on Twitter @arthurhill - Keep up with my 140 character commentaries.
****************************************
Thanks for tuning in and have a good day!
--Arthur Hill CMT
Plan your Trade and Trade your Plan
*****************************************


