Comparing the Current Decline with Prior Events .... Measuring Selling Climaxes .... Just a Pullback or More? .... Three Items Marking Next Support for the S&P 500 .... Putting EMA Crosses to the Test .... Mean Reversion Systems have Positive Expectancy .... //// ....
Comparing the Current Decline with Prior Events
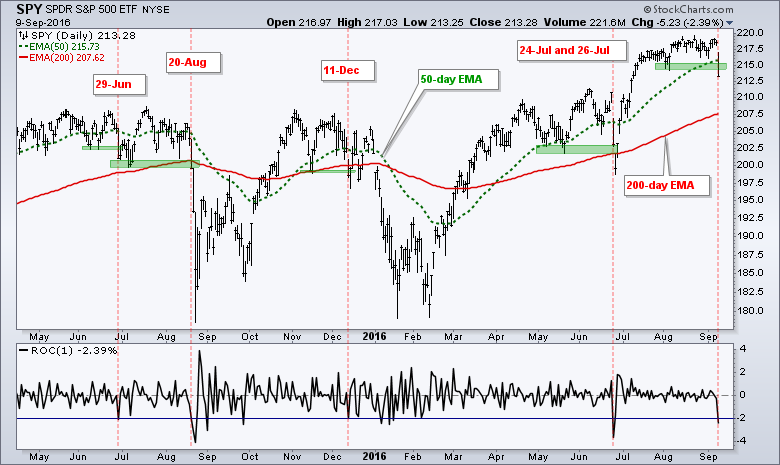
The major index ETFs broke short-term support levels with gaps and sharp declines. SPY fell 2.39% and this is the biggest decline since the Brexit debacle. The chart below shows the ETF breaking the early August low and closing below its 50-day EMA. The red dashed lines show when the ETF fell more than 2% in one day, broke support and broke the 50-day EMA. These prior events occurred in late June 2015, late August 2015, mid December 2015 and late June 2016 (Brexit). Also notice that SPY broke the 200-day EMA in August, December and July, but not in June. There is one big difference between the prior three breakdowns and the current breakdown: SPY remains well above the 200-day EMA. Thus, Friday's decline, while dramatic, has yet to affect the long-term trend. Also notice that the 50-day EMA is still well above the 200-day EMA.
Measuring Selling Climaxes
The S&P 500 SPDR (SPY) is by far the most active ETF and SPY tracks the most widely followed benchmark for the stock market. I do not use exchange volume or ETF volume very much, but I think there is some value when looking for selling climaxes using SPY volume. The next chart shows SPY with volume and the Percentage Volume Oscillator (PVO). A selling climax occurs when prices decline sharply on exceptionally high volume. It is basically a fear-driven washout that is accompanied by a spike in the S&P 500 Volatility Index ($VIX).

Based on recent signals, a selling climax occurs when SPY volume exceeds 300 million shares and/or the Percentage Volume Oscillator (2,250,1) exceeds 100, which means the 2-day EMA of volume is more than double the 250-day EMA of volume. The prior three signals are marked in green and SPY has yet to experience a selling climax, which means we may see more downside.
Just a Pullback or More?
Is this just a short-term pullback or the start of a bigger downtrend? My long-term indicators have yet to turn bearish for the broad market so I am still in the "just a short-term pullback" camp. I will cover broad market breadth and sector breadth in detail on Tuesday. With the bigger uptrend still in place, this means pullbacks present opportunities, not threats. Unfortunately, there are a lot of outside events that could keep the market on edge in the coming weeks and Wall Street hates uncertainty. The US election is, of course, the 800-pound gorilla in the room right now. Throw in a Fed meeting next week and this means we could see more volatility (aka downside) before the markets settle.
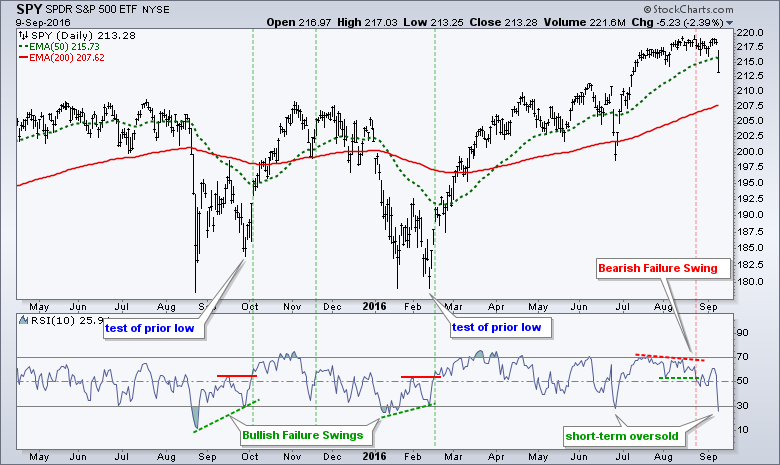
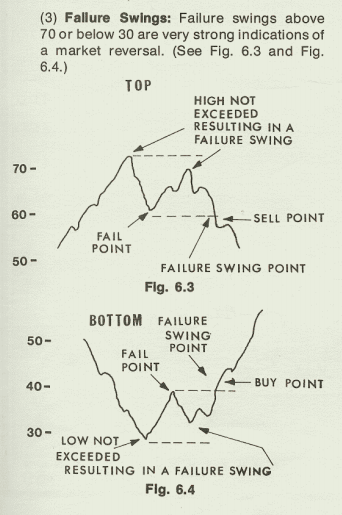
How might a settling process evolve? The chart above shows SPY with 10-day RSI in the indicator window. After the breakdowns and 10+ percent declines in August 2015 and January 2016, it took the market a little over a month to settle and ultimately reverse. Bullish Failure Swings marked the reversals in October and February. These were identified by Welles Wilder, creator of RSI, and detailed in his book: New Concepts in Technical Trading Systems (1978). A bullish Failure Swing occurs when RSI moves below 30, bounces above 30, pulls back, holds above 30, and then clears its prior high. This occurred in August-September and January-February. Notice that SPY had time to settle and tests its prior low during this process. Thus, a few more weeks of uncertainty could lead to some sort of deep dip, test of support and a bullish Failure Swing. RSI is currently oversold so the first part of the equation is in place. Before leaving RSI, notice that there was a Bearish Failure Swing in late August. The image below comes from Wilder's book.
Three Items Marking Next Support for the S&P 500
I do not use moving averages to mark support or resistance. However, the S&P 500 is the most widely followed stock market benchmark and the 200-day SMA is perhaps the most popular long-term moving average. Thus, the idea that a moving average may offer support or resistance may actually work for the S&P 500 and the 200-day SMA. In other words, it may be a self-fulfilling prophecy because the index and moving average are so widely followed.
The chart below shows the index with the 200-day SMA in red and the 200-day EMA in green. Notice that there is quite a big difference between the two (~30 points). Given the choice, I would defer to the 200-day SMA for potential support. With this in mind, I see a support zone in the 2050 area marked by three items: the 200-day SMA, the 38.2% Fibonacci retracement and the April-May lows. This appears to be one of the make-or-break areas for the long-term uptrend. Note that this level is lower than the level proposed in Friday's commentary.

I use the 50-day EMA and 200-day EMA of the S&P 500 for a directional bias. It is very simple. The directional bias (trend) is up when the 50-day EMA is above the 200-day EMA. The directional bias (trend) is down when the 50-day EMA is below the 200-day EMA. Chartists can measure this difference using the Percentage Price Oscillator (50,200,1). The PPO is positive when the 50-day EMA is above the 200-day EMA and negative when the 50-day EMA is below the 200-day EMA. I prefer exponential moving averages for this directional bias because they are weighted more towards recent price action.
Putting EMA Crosses to the Test
The table below shows the backtest results for the EMA crossover system using SPY. The system goes long when the 50-day EMA crosses above the 200-day EMA and exits when the 50-day EMA crosses below the 200-day EMA. Adding short positions increases the maximum drawdown and does not improve the returns. In other words, short positions just increase risk and are not worth the trouble. As the table below shows, a simple system using these classic EMAs beats buy-and-hold. Even though the 9.68% Compound Annual Return is just slightly higher than the buy-and-hold Compound Annual Return of 9.02%, the Maximum Drawdown is much better and the Risk-adjusted Return is much higher.

Mean Reversion Systems have Positive Expectancy
The second table shows a system that buys SPY when the 50-day EMA is above the 200-day EMA and RSI dips below a certain level. The system on the first row buys when 5-day RSI dips below 25 and sells when 5-day RSI crosses above 75. The second system buys when 10-day RSI dips below 30 and sells when 10-day RSI crosses above 70. This is a long-only mean-reversion system that only trades when the 50-day EMA is above the 200-day EMA. The signals are based on closing prices. The actual trades are based on the next open.

As the results show, the system is profitable with a Compound Annual Return near 8% and a Risk-adjusted Return above 25%. This Risk-adjusted Return is high because the system is invested just 30% of the time. Notice that the Average Gain is slightly higher than the Average Loss, but the winning percentages are very high. The 5-day RSI system has 62 winners and 12 losers. The 10-day RSI system has 32 winners and 2 losers.
Before getting too excited about this system, note that there is NO stop-loss and the exit is based on RSI moving above 70. It may sound crazy, but the results speak for themselves. As the chart below shows, it would have been a tough system to trade when signals triggered in August 2015 and January 2016. One would have ridden the volatility and then exited on the biggest rebound.

These system were tested using Amibroker with the help of Cesar Alvarez of AlvarezQuantTrading.com. Cesar wrote High Probability ETF Trading, Short-term Trading Strategies that work. For more information about his testing and consulting services, click here.
******************************************************
Measuring Risk On-Risk Off - Using charts to quantify stock, economic and credit risk.
PPO Trading Strategy - How to use 3 PPOs to develop a trend-reversion trading strategy.
Long-term Trend Indicators - Using the PPO, EMA Slope and CCI to determine the trend.
ETF Master ChartPack - 300+ ETFs organized in a Master ChartList and in individual groups.
Follow me on Twitter @arthurhill - Keep up with my 140 character commentaries.
****************************************
Thanks for tuning in and have a good day!
--Arthur Hill CMT
Plan your Trade and Trade your Plan
*****************************************


