Long-term Trend Overrides Short-term Weakness .... Percent above 200-day EMA Remains Strong .... SPY Follows Through on Inside Day Reversal .... QQQ Leads as IWM Challenges High .... Housing and Retail are Still Lagging .... Regional Banks Extend Correction .... Treasuries Surge within Corrective Patterns .... //// ....
Long-term Trend Overrides Short-term Weakness
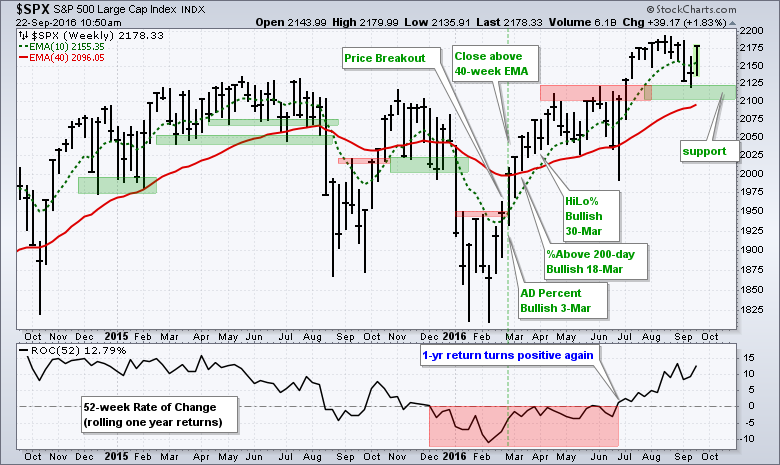
Stocks fell sharply in early September with the S&P 500 suffering its biggest weekly decline since February. And that was pretty much it. The index firmed last week and shot higher this week. The moral of the story is a classic: the long-term trend is greater than the short-term trend. This means that short-term support breaks can be a mere nuisance when the long-term trend is up. It also means that short-term pullbacks and oversold conditions are usually opportunities, not threats. Let's first review the weekly chart for the S&P 500, which is really the only index we need to watch. I will make detail this argument at ChartCon on Friday morning and back it up with some numbers. The chart below shows the breadth signals, price breakouts and bullish EMA crossover, all of which occurred in March. This chart has been bullish since March and the July breakout simply reaffirmed this uptrend. The broken resistance area in the 2100-2125 area turned into support and held during the early September swoon. There is no reason to be negative on stocks as long as the S&P 500 holds 2100.
Percent above 200-day EMA Remains Strong
Before looking at some short-term charts, let's review the breadth indicators. The chart below shows the S&P 1500 Index in the top window and three S&P 1500 breadth indicators. You can read all about these indicators in this article. The 10-day EMA of AD Percent was the first to trigger bullish with a surge above +30% on March 3rd and it remains bullish. Note that it has not been below -20% since February and will not turn bearish until a plunge below -30%. High-Low Percent has been anemic the last eight days, but this is because new highs dried up. We have yet to see an expansion of new lows and I will not turn bearish on this indicator until it breaks below -10%. The percentage of S&P 1500 stocks above the 200-day EMA is at 69% and remains strong. This indicator will not turn bearish until it breaks below 40%. While some may argue that the indicators are not THAT strong, they have yet to trigger bearish signals and this means the bullish signals are still active.

SPY Follows Through on Inside Day Reversal
In last Thursday's commentary (before the open), I highlighted the short-term oversold conditions and the two inside days for the S&P 500 SPDR (SPY). The ETF surged to form a reversal of sorts and followed through with further gains the last two days. Also notice that 5-day RSI was below 30 when these inside days formed and the oscillator exceeded 70 today. I have pointed out the RSI mean reversion strategy before and this one worked again. The strategy buys when the 50-day EMA is above the 200-day EMA and 5-day RSI dips below 30. It then sells when 5-day RSI exceeds 70. There is no stop-loss in this system. Just a sell when 5-day RSI moves above 70.

QQQ Leads as IWM Challenges High
QQQ is the leader because it is already trading at a new high. The short-term reversal started with a big bullish engulfing on 12-Sept and the surge above 117 confirmed this pattern. This surge also filled the down gap. Momentum is back on the upswing as the PPO (5,30,5) turned up last week and moved above its signal line.

IWM is getting close to a new high with a surge the last few days. The lows extending back to July mark a clear support zone that held in August and September. Chartists can watch this level for the first signs of a major crack in the uptrend.
Housing and Retail are Still Lagging
The consumer discretionary sector is perhaps the biggest concern in the stock market because it is still one of the weakest (least strong) sectors since mid February. Within this sector, I am seeing relative weakness in the Retail SPDR (XRT) and the Home Construction iShares (ITB). Even though the market can still rise without these two, they represent key areas of the economy and it would be nice to see them participate. The first chart shows XRT falling from 46 to 43 and then consolidating with a tight range the last two weeks. Watch 44 up and 43 down.

The second chart shows ITB battling the rising 200-day EMA and hitting its moment-of-truth. There is still an upward trajectory on this chart with the higher highs and higher lows since April, but the ETF has shown relative weakness since August and has yet to sustain a bounce in September. A bounce is needed soon to keep the string of higher lows in place. Look for a break above 28 to put ITB back on the bullish track.

Regional Banks Extend Correction
The Regional Bank SPDR (KRE) is also struggling in September. The ETF was leading in August, but fell back the last three weeks with what could be a falling flag of sorts. Falling flags are bullish continuation patterns so the odds favor an upside breakout. Look for a break above 42.5 to reverse this fall and resume the bigger uptrend. RSI(5) almost became oversold when it hit 30.18 on September 14th. Again, I think the bigger trend is up for KRE and this means pullbacks are opportunities, not threats.

Treasuries Surge within Corrective Patterns
Treasury bonds reacted to the Fed with a surge over the last two days and this means Treasury yields fell. At the risk of sewing the seeds of confusion, I see three trends at work on the charts. First, the long-term trends are still up because the 7-10 YR T-Bond ETF (IEF) and 20+ YR T-Bond ETF (TLT) hit 52-week highs this summer. Second, the immediate trends are down because both fell over the last two and a half months. Third, the short-term trends reverse with surges over the last two days. Confused? Me too!

The IEF chart shows the 50-day EMA above the 200-day EMA, price above the 200-day EMA and a 52-week high in early July. The long-term trend is clearly up. A wedge formed since early July and this could be a correction within that long-term uptrend. A break above the early September high would end this correction and signal a resumption of the bigger uptrend. Within the wedge, we have a reversal with a sharp decline below 110, a two week stall and a surge above 111.5 this week. I have to take a stand somewhere and I will default to the falling wedge, which is bearish until a breakout. This means I am not putting much weight in the short-term reversal until we see a wedge breakout.

******************************************************
Measuring Risk On-Risk Off - Using charts to quantify stock, economic and credit risk.
PPO Trading Strategy - How to use 3 PPOs to develop a trend-reversion trading strategy.
Long-term Trend Indicators - Using the PPO, EMA Slope and CCI to determine the trend.
ETF Master ChartPack - 300+ ETFs organized in a Master ChartList and in individual groups.
Follow me on Twitter @arthurhill - Keep up with my 140 character commentaries.
****************************************
Thanks for tuning in and have a good day!
--Arthur Hill CMT
Plan your Trade and Trade your Plan
*****************************************


