Defining the Uptrends using Benchmark Lows .... Broad Market Breadth Review .... Watch the Stock-Bond Ratio for Clues on Risk Appetite .... %Above 200-day Triggers for Consumer Discretionary Sector .... Technology Sector Shows No Signs of Weakness .... Charts to Watch - XRT, ITB, XSD, KRE, XME, XES and IEF .... The Volatility Calendar .... //// ....
Defining the Uptrends using Benchmark Lows
Several major indexes established benchmark lows with the surge over the last two weeks. A benchmark low is a reaction low or price trough that marks a level where buying pressure overcame selling pressure. This low is now the first important level to watch going forward. A break below this low would signal a significant increase in selling pressure and could signal the start of a correction in the stock market. Keep in mind that the bulls are clearly in control right now. As the chart below shows, the S&P MidCap 400, S&P Small-Cap 600 and Nasdaq 100 hit new highs in September. The S&P 500 did not confirm these highs, but three of four is bullish enough for me. Also notice that all four are above their 200-day EMAs and the 50-day EMAs are above the 200-day EMAs.
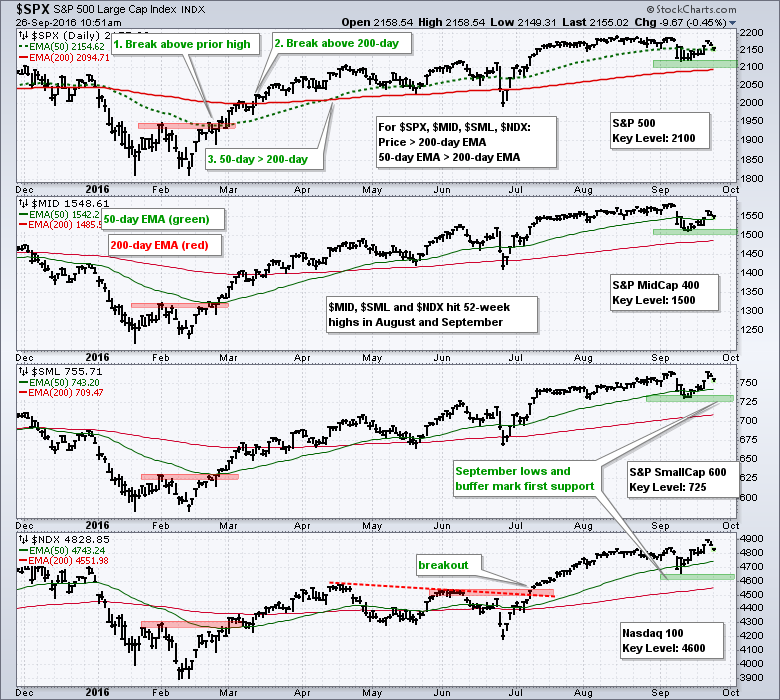
I am marking support zones by using the benchmark lows and a buffer. These green zones mark the key levels to watch for each index. The bulls are in good shape as long as all four indexes remain above these levels. Support breaks in two or more of the indexes would be quite negative for the market. Investors and traders can then consider taking a more defensive posture, especially since we are nearing the end of September and October is approaching.
Broad Market Breadth Review
The breadth indicators for the S&P 1500 remains bullish, but High-Low Percent has softened over the last few weeks. I am working under the premise that a signal is valid until there is a counter signal. The breadth indicators started turning bullish when the 10-day EMA of AD Percent for the S&P 1500 moved above 30% on March 3rd. High-Low Percent and the Percentage of Stocks above the 200-day followed suit on March 31st. Even though High-Low Percent did not make it above 10% with the market surge last week, it is not even close to triggering a bearish signal. The 10-day EMA for AD Percent bounced last week and exceeded +20% so it too is not near a bearish signal, which would require a move below -30%. The Percentage of Stocks above the 200-day EMA remains near 70% and this indicator is quite far from a bearish signal (move below 40%).

Watch the Stock-Bond Ratio for Clues on Risk Appetite
Stocks are risk assets and Treasury bonds are relative safe havens. It's all relative in the investment world so chartists can watch the stock-bond ratio for clues on the risk environment. From a stock market standpoint, we want to see stocks outperforming Treasury bonds because this means the market is more interested in risk. Relative strength in Treasury bonds means the market is more interested in safety and this is negative for the broader market. The chart below captures the risk environment using the SPY:IEF ratio. There was a whipsaw breakdown during the Brexit days, but this ratio has been largely rising since early March. Most recently, this ratio flattened out the last seven weeks and I am watching this range for a resolution that may affect the stock market. An upside breakout would show relative strength in stocks and this would signal risk ON. A downside break would show relative weakness in stocks and this would signal risk OFF.

%Above 200-day Triggers for Consumer Discretionary Sector
The next four charts focus on what I refer to as the "offensive" sectors. Each chart shows the sector SPDR, the equal-weight sector ETF, the 10-day EMA of AD Percent, High-Low Percent and the Percent Above 200-day EMA. Note that these breadth indicators are sector specific. Also note that I am showing the sector charts with the 5-day EMA in green and the 200-day EMA in red. The 5-day EMA smooths out the daily price fluctuations and the 200-day EMA gives us a benchmark level to define the trend. Trend is up when the 5-day EMA is above and down when below. Overall, there are five plots on this chart and we can use these for a weight of the evidence approach to sector analysis. The evidence is bearish when at least 3 of the 5 are bearish. The evidence is bullish when at least 3 of the 5 are bullish.
The first chart shows the consumer discretionary sector, which is the most economically sensitive sector and the weakest of the four. Four of the five indicators are still on bullish signals, but I am watching this one closely because it would not take much to turn the weight bearish. Both sector ETFs are in uptrends, but their 5-day EMAs are close to their 200-day EMAs and it would not take much for bearish crossovers. The 10-day EMA of XLY AD Percent plunged in early September, but did not break the -30% threshold to turn bearish. High-Low Percent has yet to turn bearish, but new lows have outpaced new highs several times over the last few weeks. A break below -10% would be bearish. The %Above 200-day triggered bearish with a move below -40% on September 9th. Note that this is the only sector to trigger bearish on this indicator.

Technology Sector Shows No Signs of Weakness
The next chart shows the technology sector with the same five indicators. The sector may be ripe for a correction, but the weight of the evidence is bullish overall. The trends for the Technology SPDR (XLK) and EW Technology ETF (RYT) are clearly up and strong. The 10-day EMA of AD Percent has been on a bullish signal since 22-Feb. High-Low Percent has been bullish since 21-Mar and the %Above 200-day EMA has been bullish since 11-Mar.

The weight of the evidence remains bullish for the finance sector. There was a bearish dip in late June, but the sector recovered quite quickly with a surge in early July. Currently, High-Low Percent has weakened over the last few weeks, but we have yet to see new lows expand.

The last chart shows the industrials sector and the weight of the evidence is bullish. High-Low Percent went negative for a few days in September, but not deeply negative as the indicator remained well above the -10% bearish threshold.

The weight of the evidence remains bullish for all four sectors right now. The trouble starts when the weight of the evidence turns bearish for two of the four sectors. I am not going to jump the gun here and will simply stay bullish on the broader market until there is a reason to turn bearish.
Chartists can create these charts for the other five sectors by substituting the sector SPDR symbol in each breadth indicator symbol. For example, change XLY to XLE to move from the Consumer Discretionary HiLo% ($XLYHLP) to the Energy HiLo% ($XLEHLP).
Charts to Watch- XRT, ITB, XSD, KRE, XME, XES and IEF
The Retail SPDR (XRT) and the Home Construction iShares (ITB) are weighing on the consumer discretionary sector. XRT needs to break 44 and ITB needs to break 28 to boost the sector.


The Semiconductor SPDR (XSD) remains strong with the September low marking a benchmark low and key support.

The Regional Bank SPDR (KRE) continues to consolidate and it is possible that a triangle is taking shape Watch 42.5 up and 41.5 down.

The Metals & Mining SPDR (XME) is perking up with break above the channel trend line.

The Oil & Gas Equip & Services SPDR (XES) got a bounce within its downtrend and it is possible that a falling wedge is taking shape. Need a follow through breakout at 18.5 to reverse the downtrend.

The 7-10 YR T-Bond ETF (IEF) is nearing its moment-of-truth after a sharp rise the last two weeks. A break above the early September high would reverse the falling wedge correction and signal a continuation of the bigger uptrend.

The Volatility Calendar
And last, but not least, here are some upcoming events that would stir up a little volatility in the markets.
- 26-Sep (Monday): First presidential debate
- 1-Oct (Saturday): Government debt ceiling deadline
- 4-Oct (Tuesday): Vice presidential debate
- 7-Oct (Friday): Employment report
- 9-Oct (Sunday): Second presidential debate
- 19-Oct (Wednesday): Third presidential debate
- 1-Nov (Tuesday): Six month cycle turns bullish
- 8-Nov (Tuesday): US election
- 9-Nov (Wednesday): Post-election performance chasing? (Thomas Lee).
******************************************************
Measuring Risk On-Risk Off - Using charts to quantify stock, economic and credit risk.
PPO Trading Strategy - How to use 3 PPOs to develop a trend-reversion trading strategy.
Long-term Trend Indicators - Using the PPO, EMA Slope and CCI to determine the trend.
ETF Master ChartPack - 300+ ETFs organized in a Master ChartList and in individual groups.
Follow me on Twitter @arthurhill - Keep up with my 140 character commentaries.
****************************************
Thanks for tuning in and have a good day!
--Arthur Hill CMT
Plan your Trade and Trade your Plan
*****************************************


