Technology ETFs Establish Key Levels to Watch .... Semis and Networking ETFs Follow Suit .... Cisco Forms a Pair of Inside Days .... A Big Counter-Trend Advance in XLE .... Crude Remains in Long-term Downtrend .... Biotech SPDR Holds its Breakout .... Three Big Biotechs to Watch .... //// ....
Technology ETFs Establish Key Levels to Watch
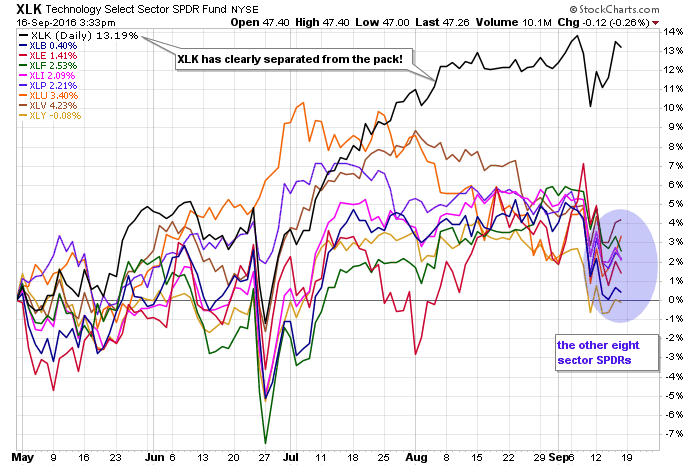
The technology sector is the strongest in the market right now with both the Technology SPDR (XLK) and the EW Technology ETF (RYT) surging this week. This is clearly bullish for the sectors and positive for the broader market. Note that XLK accounts for 21% of the S&P 500 and RYT accounts for 14% of the EW S&P 500 ETF (RSP). As the two leaders in the stock market, chartists should pay particular attention to their charts because both established chart support with bounces this week.
The first chart shows XLK with a long black candlestick last week and an immediate recovery this week. The trend is clearly up and this week's low now marks the first support level to watch (45.86). Failure to hold last week's gains and a close below this level would be quite negative. In fact, just look back to late 2015 when XLK fell sharply and erased the gains from the long white candlestick in November (blue oval). It has not happened yet and I am not necessarily expecting it to happen. In fact, I try to keep my expectations to a minimum and just let the chart tell me what is happening. The happening right now is bullish and it has yet to be proven otherwise.


Semis and Networking ETFs Follow Suit
We can do this same exercise with some key industry group ETFs within the technology sector. The charts below are bullish with this week's low marking the first support level to watch. The Networking iShares (IGN) has support at 38.80, the Semiconductor iShares (SOXX) has support at 103.33 and the Semiconductor SPDR (XSD) has support at 48.57.


Cisco Forms a Pair of Inside Days
Within the networking group, Cisco remains strong and has yet to break down. The chart below shows CSCO forming a higher low in June and breaking above resistance in July with a big surge. The stock fell back after the 52-week high in early September and then formed two inside days. Notice that the long white candlesticks were both followed by inside days and the stock has been stuck in a one point range the last six days, Watch this range for the first directional clue.

ChartCon 2016
I will be traveling on Monday-Tuesday next week and will not post a commentary until Wednesday. Most of us are arriving for ChartCon on Wednesday. This year's line up is great and I hope to see you there (virtually). I will be presenting a momentum strategy for trading stocks in the S&P 1500. It is backtested and I will show how to implement it using the tools at StockCharts. Click here to register.

A Big Counter-Trend Advance in XLE
I wrote about the Energy SPDR (XLE) on Thursday and would like to expand on this sector with a weekly chart. XLE is still one of the best performing sectors in 2016, but it is also one of the worst performing sectors since January 2015. Also notice that the price relative (XLE:SPY ratio) has flat-lined since April and XLE is just treading water relative to the broader market. On the price chart, the advance from January to September could be one big counter-trend advance (correction within a bigger downtrend). At this point, the trend since January 2016 is still up and this is the most important timeframe on the chart. Chartists can mark support with the early August low. A break here would end the counter-trend advance and signal a continuation of the bigger downtrend.

Crude Remains in Long-term Downtrend
Energy could be vulnerable because oil broke down in July and this breakdown is holding. The chart below shows the USO Oil Fund (USO) in the top window for reference and December Crude (^CLZ16) in the bottom window for analysis. I prefer the futures contract for analysis because they truly reflect the supply-demand dynamics in the market. Notice that crude advanced with a rising channel from January to June and broke channel support in July. The high of this channel did not exceed the October high (lower high) and crude formed a 52-week low in January. The 52-week low and lower high are indicative of a long-term downtrend, while the channel break indicates that this downtrend is continuing. I will mark resistance at August high and maintain a bearish stance until a break above this level.

Biotech SPDR Holds its Breakout
Biotechs continue to perk up with the Biotech SPDR (XBI) hitting its highest level since early January. The chart shows XBI with a series of higher lows and higher highs since February and a resistance breakout at 60. The ETF fell back to broken resistance in August and found support with the September bounce. Chartists can now mark key support with the late August low. A close below this level would totally erase this week's bounce and negate the July breakout.


The Biotech iShares (IBB) also got a bounce, but IBB is not as strong as XBI. Nevertheless, it is possible that IBB is forming some sort of a bottom because the ETF tested the 240 level a few times and broke above the April-May highs in July. Even though IBB fell back below this breakout, notice that the pullback looks like a falling flag of sorts and a flag breakout is in the making. Chartists can use this week's low to mark first support.
Three Big Biotechs to Watch
Amgen (AMGN) has a bullish continuation pattern working as the stock surged in July and then consolidated. While I cannot draw trend lines for a picture-perfect flag, the essence of the pattern is clearly visible.

Celgene (CELG) formed a long base from February to June and broke out with a surge in July. As with IBB above, CELG fell back below the breakout as the correction overstayed its welcome a bit. Nevertheless, CELG is at a moment-of-truth because the pullback is right near the 62% retracement.

The third chart shows Regeneron (REGN) forging a higher high in early August by exceeding the April high. REGN does not have a base like CELG because the ETF hit a new low in June. However, the higher high reflects strong buying pressure and the decline back to the 385 area looks corrective.

******************************************************
Measuring Risk On-Risk Off - Using charts to quantify stock, economic and credit risk.
PPO Trading Strategy - How to use 3 PPOs to develop a trend-reversion trading strategy.
Long-term Trend Indicators - Using the PPO, EMA Slope and CCI to determine the trend.
ETF Master ChartPack - 300+ ETFs organized in a Master ChartList and in individual groups.
Follow me on Twitter @arthurhill - Keep up with my 140 character commentaries.
****************************************
Thanks for tuning in and have a good day!
--Arthur Hill CMT
Plan your Trade and Trade your Plan
*****************************************


