Broad Market Breadth Remains Bullish .... SPY Holds above Resistance Break .... 7-10 YR T-Bond ETF Fails to Hold Gains .... Oil Breaks a Wedge .... A Couple Dozen Charts to Watch .... //// ....
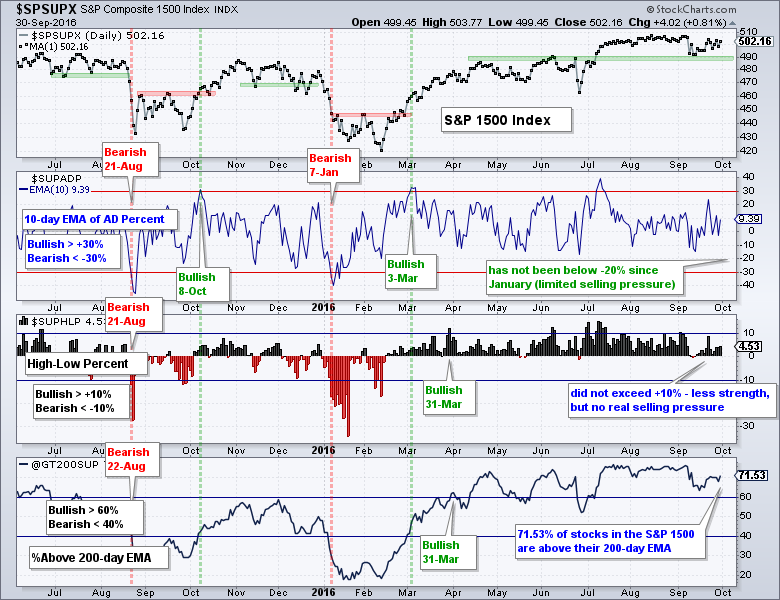
Broad market breadth turned bullish in March and will remain bullish until there is a bearish signal. I use breadth indicators for early warnings and confirmation of the existing trend. Breadth may not seem as strong as it was in early July, but I am not concerned with "less strength" because this can happen during corrective periods. Instead, I change my stance when selling pressure truly expands and breadth indicators trigger bearish signals. I do not know when we will see bearish signals and will simply have to abide by the bullish signals until they are proven otherwise. The chart below shows S&P 1500 High-Low Percent ($SUPHLP) failing to exceed +10% over the last few weeks. This shows less strength, but we have yet to see a serious expansion of new lows and this indicator is not close to a bearish signal. Notice that over 70% of stocks in the S&P 1500 are above their 200-day EMA.
Throwback Affirms New Support for SPY
In my ChartCon presentation, I argued that the S&P 500 (and SPY by extension) is the only index we need to follow when it comes to the broader market. The S&P 500 covers some 80% of the total US equity market and it is by far the most widely followed benchmark for US stocks. Further more, a long-only 10-week/40-week EMA crossover system returned around 8% per year since 2001 and kept investors on the right side of the trend. This included two bear markets and the system was out of the market for most of these declines. I bet that 95% of market timers could not beat the 10-week/40-week EMA crossover system.
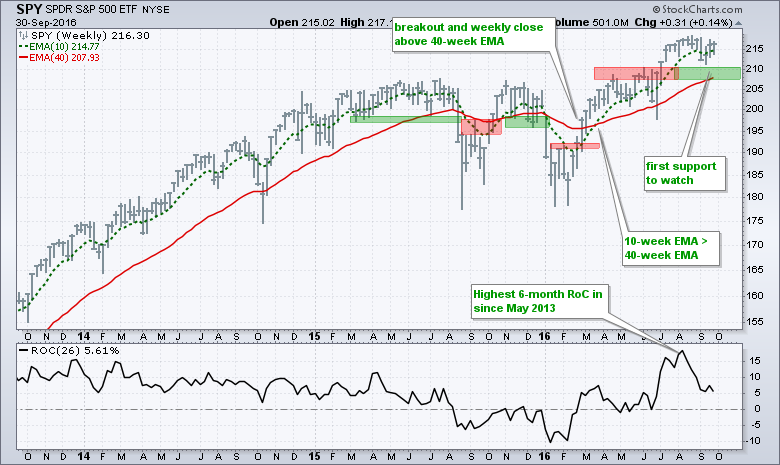
I use the S&P 500 trend indicators and basic trend analysis for market direction. As the chart above shows, SPY broke above resistance in mid February, the 10-week EMA crossed above the 40-week EMA in late March and the ETF hit a 52-week high in April. Most recently, the ETF broke above a resistance zone in July and remains above this resistance zone. Broken resistance turns into support in the 208-210 area. The rising 40-week is also entering this zone. I would not become concerned with the current bull market unless SPY closes below 208.
We are currently in a bull market environment because market breadth is bullish and the S&P 500 is in bull mode. Working under this assumption, pullbacks are considered corrections within the bigger uptrend and corrections are opportunities, not threats. A bull market environment also means I am not interested in short-term bearish signals or short positions in stocks. Instead, I am interested in short-term bullish signals, short-term oversold readings and stocks showing relative strength.
7-10 YR T-Bond ETF Fails to Hold Gains
The 7-10 YR T-Bond ETF (IEF) appears to be in a long-term uptrend with a falling wedge forming over the last three months. A falling wedge is usually a corrective pattern that resolves itself with an upside breakout. IEF broke above the wedge trend line with a surge above 112 during the week, but fell back below 112 with a sharp sell off on Friday. Thus, the three month trend remains down and a close above 112.5 is needed for an upside breakout.
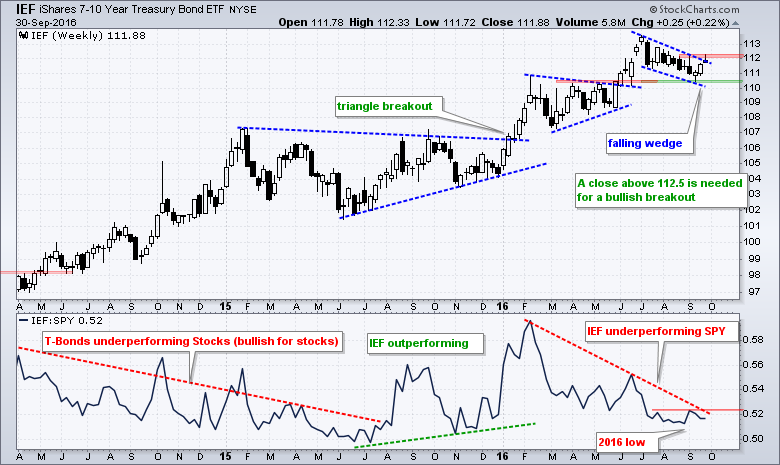
The three month downtrend in IEF translates into a three month uptrend for the 10-yr T-Yield ($TNX) and this is positive for financials (banks, brokers, insurers). As far as the broader market is concerned, IEF is underperforming SPY because the IEF:SPY ratio hit new lows for the year in August. A break above the early September high would show relative strength in Treasury bonds and this would be negative for stocks.
Oil Breaks a Wedge
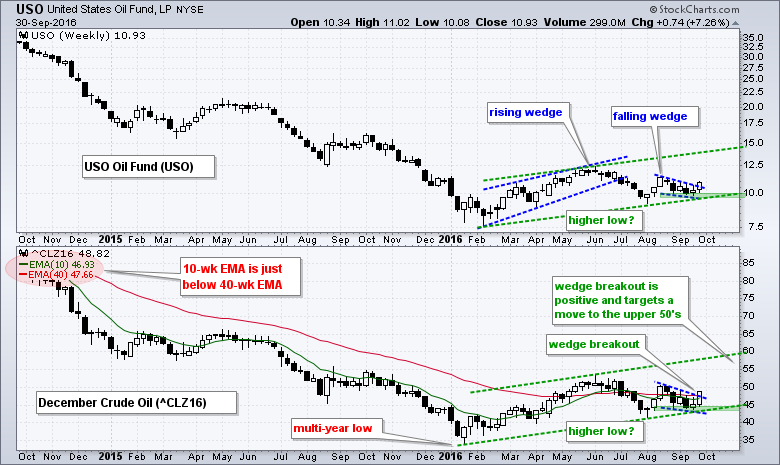
Even though I am reluctant to react to a price move driven by an OPEC decision, the oil chart has a bullish setup working and we could see a move to the upper 50s. The bottom window shows December Crude (^CLZ16) with a higher low from January to August and a wedge breakout last week. A strong breakout should hold so a quick move back below 46.5 would be cause to question the move. The breakout is bullish as long as it holds and this targets a move to the upper 50s. This upside target is based on the upper trend line of a possible rising channel. It is NOT a hard target so take it with a bucket of salt.
A Couple Dozen Charts to Watch
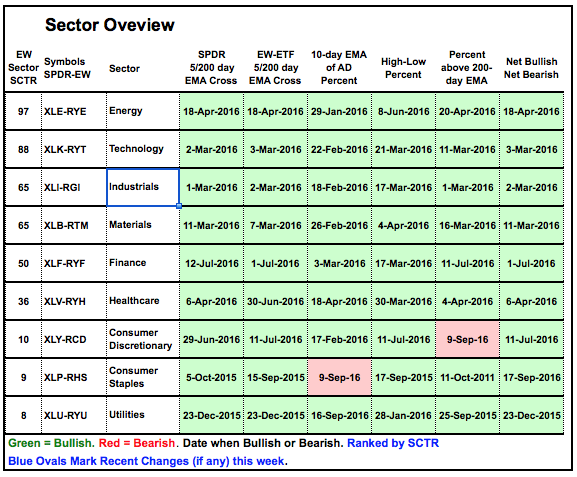
I have updated the Art's Charts ChartList with dozens of annotated ETF charts and comments. The sector charts include the key breadth indicators, which are summarized in the table below. Notice that all nine sectors are net bullish. The consumer discretionary and the consumer staples sector each have one bearish indicator, but the other indicators are still bullish. There is lots of green on this sector table and this reinforces the bullish environment for the stock market right now.
Here are some chart highlights:
- Marking short-term supports for SPY and QQQ
- IWM formed a bullish pennant the last five days
- Industrials High-Low% ($XLIHLP) exceeded +10%
- The 10-day EMA of Utilities AD% ($XLUADP) plunged to -28%
- 86% of stocks in Energy SPDR (XLE) are above 200-day EMA
- XRT and ITB are struggling, but 50-day EMAs remain above 200-day EMAs.
- Tech ETFs are dominating with new highs in $HACK, $IGN, $SMH, $FDN and $XSD
- KRE and KBE have falling flags working (bullish continuation patterns)
- VNQ formed another lower high as the PPO turned down.
- GDX could be poised for a break as Aroon indicators fall below 30
- XBI falls back to breakout zone, which becomes first support
Click here to see the live charts in the ChartList.
******************************************************
Measuring Risk On-Risk Off - Using charts to quantify stock, economic and credit risk.
PPO Trading Strategy - How to use 3 PPOs to develop a trend-reversion trading strategy.
Long-term Trend Indicators - Using the PPO, EMA Slope and CCI to determine the trend.
ETF Master ChartPack - 300+ ETFs organized in a Master ChartList and in individual groups.
Follow me on Twitter @arthurhill - Keep up with my 140 character commentaries.
****************************************
Thanks for tuning in and have a good day!
--Arthur Hill CMT
Plan your Trade and Trade your Plan
*****************************************


