September was Dull .... October has a History .... Shifting the Seasonality Chart for Two Views .... The VIX versus the Volatility ETNs .... Webinar Video .... //// ....
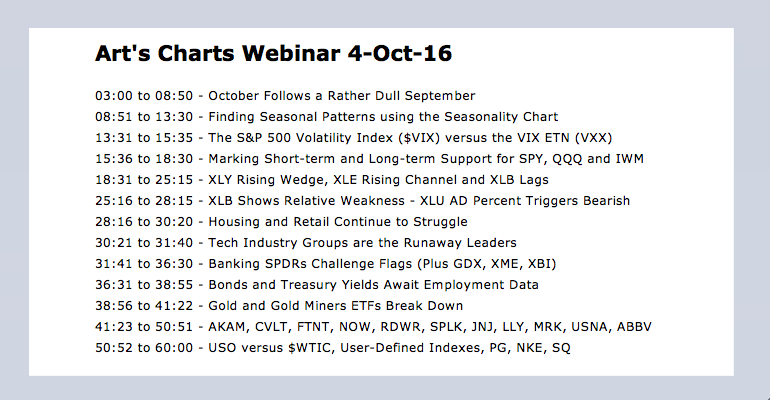 Click here for the Webinar Video
September was Dull
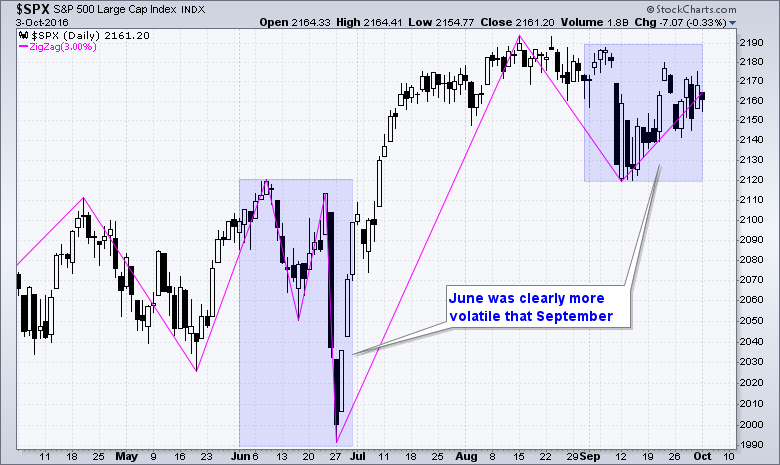
October is here and the consensus is for a volatile month. I can certainly understand the reasoning because historical data confirms that October has been the most volatile month since 1950. LPL Research notes that the average range in the S&P 500 for October was 7.32%, which is the highest of all months. August, November and January are next with an average range just over 6%. The S&P 500 traded in a 67-point range in September, which was just 3.2%. September seemed like a volatile month because of the 2.8% decline at the beginning of the month, but overall volatility was not high in September. Hmm..... September was dull and you know what they say about a dull market. The chart below shows the S&P 500 with a 3% Zigzag to highlight swings greater than 3%. June was clearly more volatile than September.
October has a History
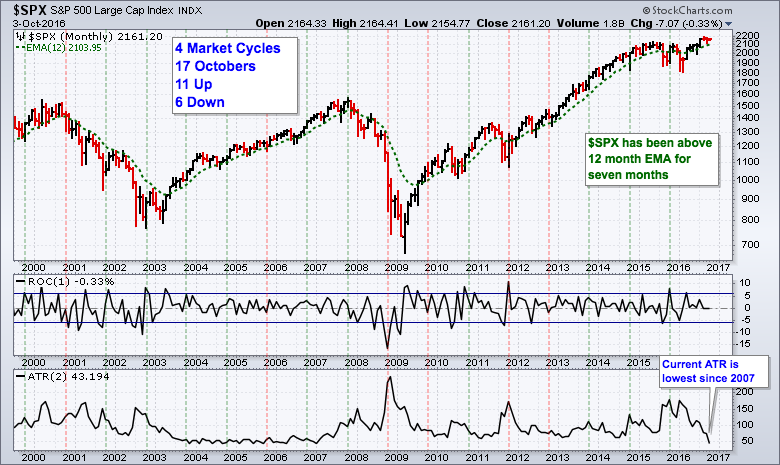
The next chart shows monthly bars for the S&P 500 over the last 17 years, which encompasses four market cycles (two bull and two bear). Over the last 17 Octobers, we have seen 11 up months and 6 down months (green and red dashed lines). Even though October is a volatile month, it has closed higher most of the time. The first indicator shows the monthly Rate-of-Change with horizontal lines at +6% and -6% for reference. The lower window shows the 2-period Average True Range (ATR). Chartists must use at least two periods because ATR uses the previous close in its formula. Even though ATR is an absolute value that is affected by the price level, we can clearly see some volatility surges in October. Notice that ATR surged above 150 last year and is currently below 50, which is its lowest level since January 2007. Thus, the S&P is currently showing the lowest volatility in years and heading into a month that is historically volatile.
Shifting the Seasonality Chart for Two Views
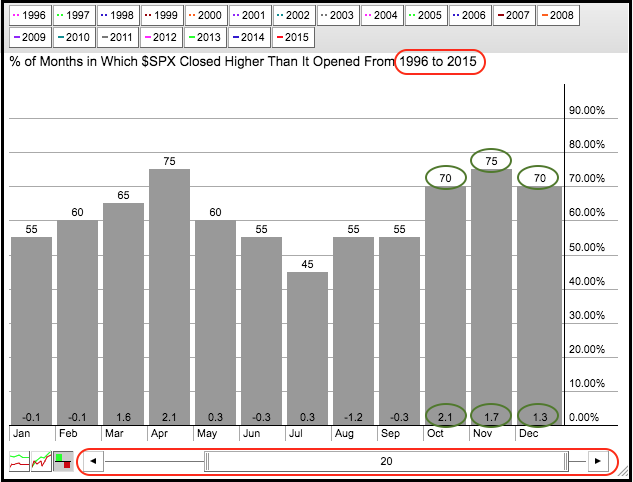
Chartists can also get a handle on seasonal patterns by using the Seasonality Chart. The example below shows that October finished higher 70% of the time over the last 20 years. Notice that I shifted the slider one year to the left because I did not want to include the current October, which is only one day old. Thus, from 1996 to 2015, October closed higher 70% of the time and the average gain was 2.1%. Also notice that the S&P 500 closed higher 75% of the time in November and 70% of the time in December from 1996 to 2015. The fourth quarter is THE strongest quarter of the year by far on this chart.
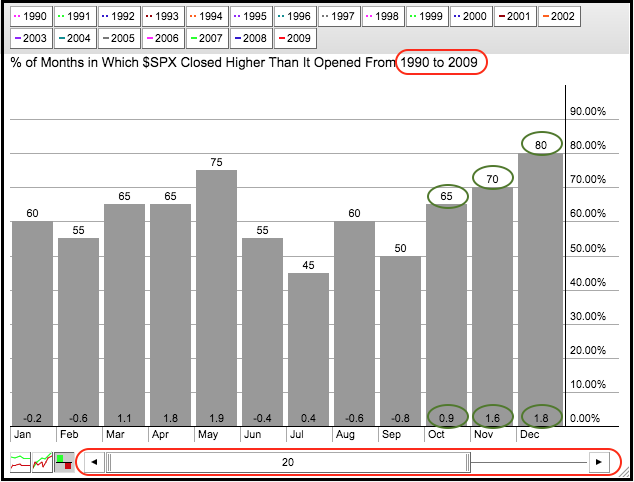
Chartists can shift the seasonality chart to the left for more perspective. The next chart shows the seasonal patterns from 1990 to 2009, which excludes much of the bull run from 2010 to now. October is still positive because it closed higher 65% of the time, but the average gain was just .9%. This is much lower than the 2.1% average gain on the prior chart. November and December remained exceptionally strong.
Even though we are moving from a bearish seasonal period (May to October) to a bullish seasonal period (November to April), I would put more emphasis on the overall trend and the bullish breadth indicators. See Monday's commentary for details. Note that the S&P 500 is up around 5% over the last five months, which accounts for first five months of the bearish six month cycle (May to September). The beairsh part of the cycle is clearly not working and this may be testament to underlying strength in the stock market. One must wonder what will happen when should the current uptrend carry over into the most bullish six month period. I will provide more details on the six month cycle and some basic trend indicators in a System Trader article on Friday.
The VIX versus the Volatility ETNs
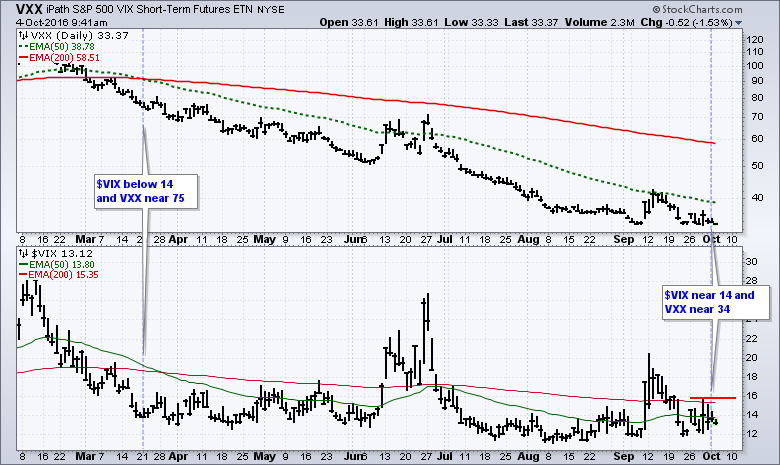
The fact that October has been the most volatile month does not guarantee above average volatility this October. Even though the narrative supports above average volatility, the market has a habit of proving the consensus forecast wrong. Furthermore, it is quite difficult to profit from volatility using the iPath S&P 500 VIX ETN (VXX) or the ProShares Ultra VIX Futures ETF (UVXY). The chart below shows the VXX in the top window and the S&P 500 Volatility Index ($VIX) in the bottom window. $VIX was near 14 in late March and VXX was in the mid 70s. $VIX is back near 14 now and VXX is down in the mid 30s. There is a downward bias in the iPath S&P 500 VIX ETN because it is based on futures contracts that must be rolled over and managed. Chartists looking to trade a volatility ETF must be extremely nimble to catch an upturn and take profits before volatility subsides. VZZ and UVXY are for short-term traders only.
******************************************************
Measuring Risk On-Risk Off - Using charts to quantify stock, economic and credit risk.
PPO Trading Strategy - How to use 3 PPOs to develop a trend-reversion trading strategy.
Long-term Trend Indicators - Using the PPO, EMA Slope and CCI to determine the trend.
ETF Master ChartPack - 300+ ETFs organized in a Master ChartList and in individual groups.
Follow me on Twitter @arthurhill - Keep up with my 140 character commentaries.
****************************************
Thanks for tuning in and have a good day!
--Arthur Hill CMT
Plan your Trade and Trade your Plan
*****************************************


