Major Index ETFs are Not that Far from Recent Highs .... Sticking with the Strategy .... Breadth Indicators Soften During Correction .... Small and Mid Caps Lead Breadth Pullback .... Breadth Summary and Conclusions .... //// ....
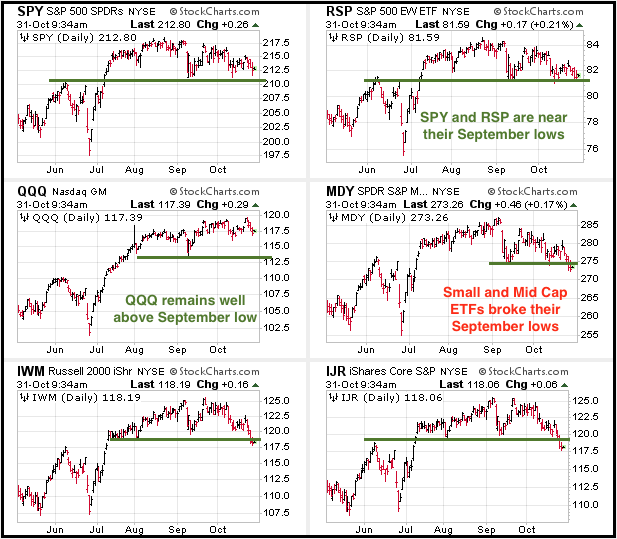
Stocks weakened over the last two months with small and mid caps leading the way lower the last six weeks. After hitting new highs in way back in September of 2016, the Russell 2000 iShares (IWM), S&P MidCap SPDR (MDY) and S&P SmallCap iShares (IJR) fell and broke below their mid September lows. Yes, I am being sarcastic because the new highs were not that long ago. These three ETFs are currently 5-7% below their 52-week highs.
Even though these "support" breaks and lower lows are negative, notice that the S&P 500 SPDR (SPY), Nasdaq 100 ETF (QQQ) and EW S&P 500 ETF (RSP) have yet to break their September lows. In addition, note that these three ETFs are just 2-4% from their 52-week highs. A 7% pullback is perfectly normal in an uptrend. A 2-4% pullback is just a blip and more like a consolidation.
Sticking with the Strategy
I have a strategy for defining the broad market environment. This strategy is based on a combination of objective indicators and subjective analysis. Nothing is completely objective because we use judgment to set indicator levels and timeframes, which makes them subjective. The objectiveness comes into play because a signal is clear. The indicator either crosses a key level or it does not. There is no such thing as the perfect indicator or the perfect setting so I do not rely on one indicator. Instead, I take a weight of the evidence approach to broad market analysis. As far as I am concerned, the weight of the evidence has been bullish since March and it remains bullish. This means that declines are viewed as corrections that create opportunities.
Breadth Indicators Soften During Correction
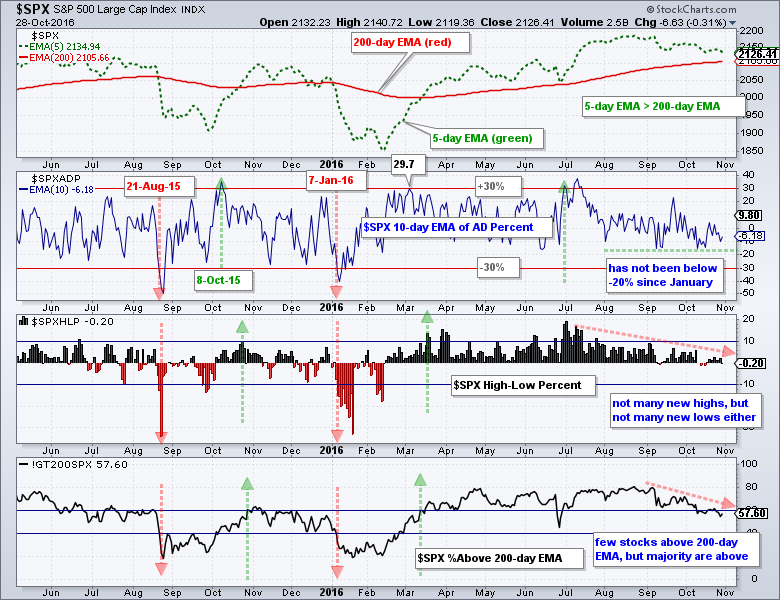
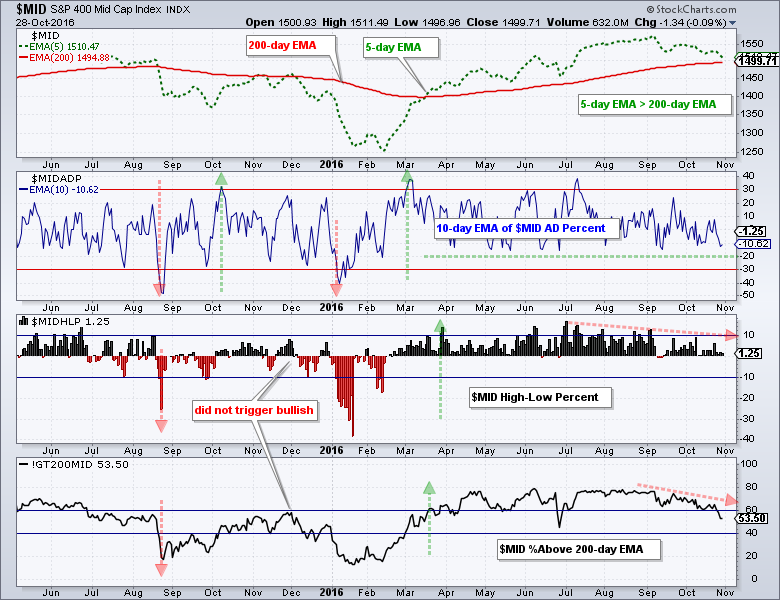
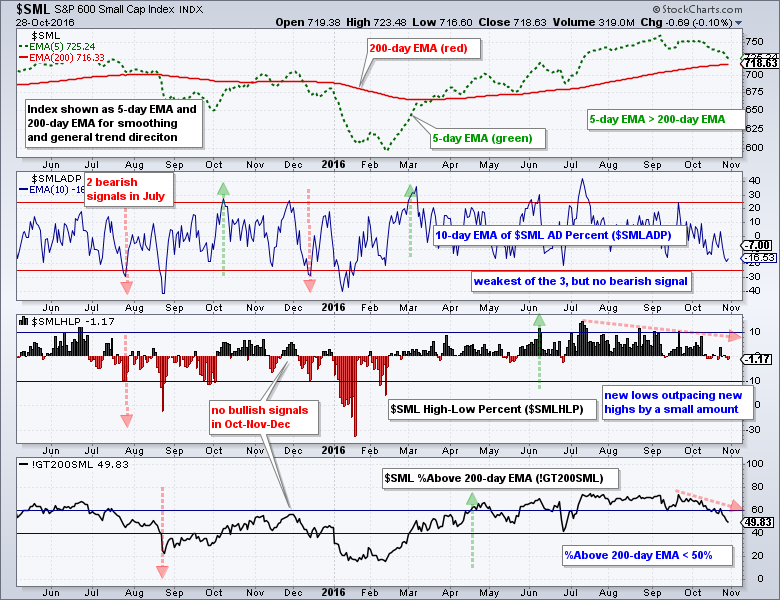
Let's start with an indicator recap. The next three charts show the S&P 500, S&P MidCap 400 and S&P Small-Cap 600 with three breadth indicators. The indexes are shown as a 5-day EMA (green) and 200-day EMA (red). The 10-day EMA of AD Percent triggers bullish with a surge above +30% and remains bullish until a plunge below -30%. High-Low Percent triggers bullish with a move above +10% and remains bullish until its moves below -10%. The %Above 200-day EMA triggers bullish with a move above 60% and bearish with a move below 40%. I set these levels to identify notable changes in participation and weed out the noise (insignificant fluctuations). The charts below show bullish breadth triggers with green arrows and bearish breadth signals with red arrows.
The chart below shows the S&P 500 with the breadth indicators in bull mode. Even though these indicators weakened over the last few months, I have yet to see a significant increase in negative breadth and this still looks like a correction. The 5-day EMA for SPY above the 200-day EMA. A close below 2100 would break the 200-day EMA. The 10-day EMA of AD Percent has oscillated around the zero line since August, but has NOT broken below -20% since January. High-Low Percent peaked in July and dipped into negative territory in October. There are fewer new highs, but we have yet to see a significant expansion of new lows. The %Above 200-day EMA fell over the last two months, but remains well above 50%.
Small and Mid Caps Lead Breadth Pullback
The S&P MidCap 400 has been net bullish since March, which is when the 5-day EMA moved above the 200-day EMA and all three breadth indicators triggered bullish signals. As with the S&P 500 indicators, we have seen some weakening in breadth over the last two months, but not enough to trigger bearish signals.
Small-cap breadth is the weakest of the three, but I have yet to get any bearish signals. The 5-day EMA for the S&P Small-Cap 600 remains above the 200-day EMA. The 10-day EMA of AD Percent is at -16.53%, but still well above the bearish threshold at -30%. New lows edged out new highs several times over the last two weeks as High-Low Percent turned red, but we have yet to see a significant expansion in new lows. The %Above 200-day EMA dipped below 50% and this is the lowest level of the three indexes. Even so, a move below 40% is needed to show a significant increase in downside participation.
Breadth Summary
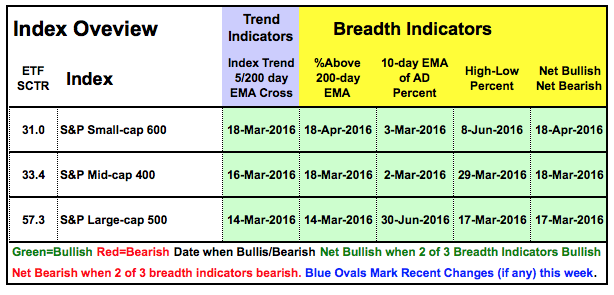
The table below sums up the trend and breadth indicators for the major index ETFs. Green boxes are bullish, red boxes are bearish and the date shows when these indicators turned bullish or bearish. All trend and breadth indicators are bullish. The breadth indicators have been net bullish since March 18th when the indicators for the S&P 500 and S&P MidCap 400 turned net bullish. The S&P Small-Cap 600 indicators turned net bullish a month later.
Conclusions
Even though the charts show the breadth indicators weakening the last two months, I view this weakening as part of the correction process. Stocks decline or move sideways during a correction and the breadth indicators reflect this corrective process. I do not know if this correction lead to bearish breadth signals and a bear market. That would be predicting the future! Instead, I will work under the assumption that broad market environment is bullish until proven otherwise and I will turn bearish when the indicators tell me to turn bearish.
Webinar Preview
Friday I wrote about an ETF scan and strategy that combines trend, momentum and relative performance. This will be covered in my webinar on Tuesday, November 1st, at 1PM ET. Click here to register.
******************************************************
Measuring Risk On-Risk Off - Using charts to quantify stock, economic and credit risk.
PPO Trading Strategy - How to use 3 PPOs to develop a trend-reversion trading strategy.
Long-term Trend Indicators - Using the PPO, EMA Slope and CCI to determine the trend.
ETF Master ChartPack - 300+ ETFs organized in a Master ChartList and in individual groups.
Follow me on Twitter @arthurhill - Keep up with my 140 character commentaries.
****************************************
Thanks for tuning in and have a good day!
--Arthur Hill CMT
Plan your Trade and Trade your Plan
*****************************************

