Lots of Low Liquidity .... Getting the ETF Master ChartPack .... Filtering for an Uptrend .... Ranking by StockCharts Technical Rank .... Ranking By Rate-of-Change .... Narrowing and Exporting Scan Results .... Analyzing with CandleGlance and RSI .... Conclusions .... //// ....
Introduction
Momentum and relative performance are related concepts that chartists can use to filter the ETF universe. Momentum refers to the Rate-of-Change over time and relative performance measures the performance of an ETF relative to other ETFs. Even though momentum and relative performance are somewhat related, chartists can combine these concepts to create a powerful scan that will narrow the ETF universe into a manageable ChartList. This article will show StockCharts members how to create a simple scan that will find the strongest ETFs. The idea is that strength begets strength. As the title suggests, we will filter for liquidity, trend, momentum and relative performance. I will then show how to export these results into a ChartList for further analysis.
The Low Liquidity Issue
There are around 1900 ETFs available in the US. This is clearly too many to analyze chart by chart so chartists need a way to reduce this number. Liquidity is the first logical step to culling the herd and this is easy to do using the scan engine. The scan code below starts with all ETFs (excluding leverage and inverse) in the StockCharts database and the second line sets the country.
[group is ETFNOUI] // symbol universe is ETF (NO inverse or leverage)
and [country is US] // set country
and [SMA(250,volume) > 200,000] // average minimum volume
// Anything preceded by two forward slashes is ignored by the scan
// engine. This is for adding notes to your scan code.
The third line requires the 250-day average of volume to be above 200,000 shares per day. This does not seem like a lot of volume, but this requirement reduced the list to 298, which is rather dramatic. This means around 15% of the ETFs in the database average more than 200,000 shares per day in trading volume. Put another way, around 85% of the ETF average less than 200,000 shares per day.
Getting the ETF Master ChartPack
A simple volume screen on the entire ETF universe is not quite enough because the results invariably include duplicates and some actively managed ETFs. I do not mean duplicate symbols, but rather ETFs that capture the same sector or market segment. For example, we do not need three ETFs for the technology sector, finance sector or the S&P 500. Chartists interested in a focused set of ETFs should check out my ETF ChartPack, which contains over 300 ETFs sorted by group. Each ETF is preceded by a six digit numeric prefix to ensure the sorting order when scrolling through the ChartList and there is a "master" ChartList with all ETFs. Below is a list of the ETF groupings:
- 27 Asset class ETFs
- 15 Major Index ETFs (QQQ, SPY, IWM....)
- 12 Style ETF (large, mid, small, value, growth)
- 27 Sector ETFs (SPDRs, Equal-weights, Small-caps)
- 68 Industry Group ETFs
- 10 Miscellaneous ETFs
- 20 Bond-related ETFs
- 31 Commodity-related ETFs
- 88 International ETFs
- 13 Currency ETFs
Even though I whittled down my ETF universe to 311, there are still many ETFs in this list that trade low volume. Note that low volume ETFs can still be used for chart analysis. For example, I like to chart the small-cap sector ETFs for analysis, but their volumes are too low for trading. For trading purposes, we need a volume filter to ensure a minimum level of liquidity. This level depends on the size of your trading positions because a 100-share trade will require less liquidity than a 10000-share trade. With most individuals trading 100 to 500 shares, I think ETFs that average over 200,000 shares per day are liquid enough for consideration.
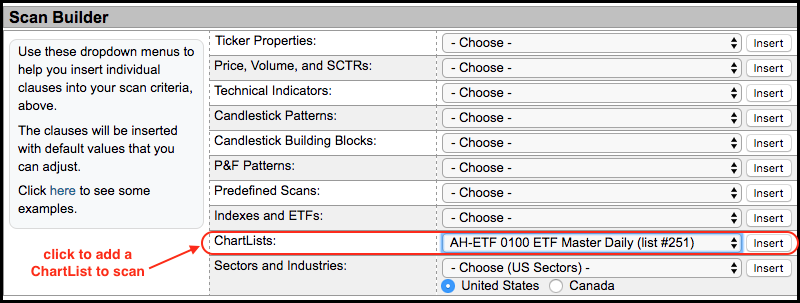
The scan code below shows a ChartList from my account on the first line. Users can "insert" a ChartList into a scan by using the drop-down menu in the Scan Builder, which is just below the Scan Criteria box. Adding this volume requirement reduces the list to 161 eligible ETFs.
[favorites list is 251] // AH-ETF 0100 ETF Master Daily ChartList*
AND [SMA(250,volume) > 200000 ] // average volume minimum
*Note that [favorites list is 251] is from my account and your ChartList 251 is likely different. You can get the AH-ETF 0100 ETF Master Daily ChartList by downloading my ETF ChartPack.
Filtering for ETFs in an Uptrend
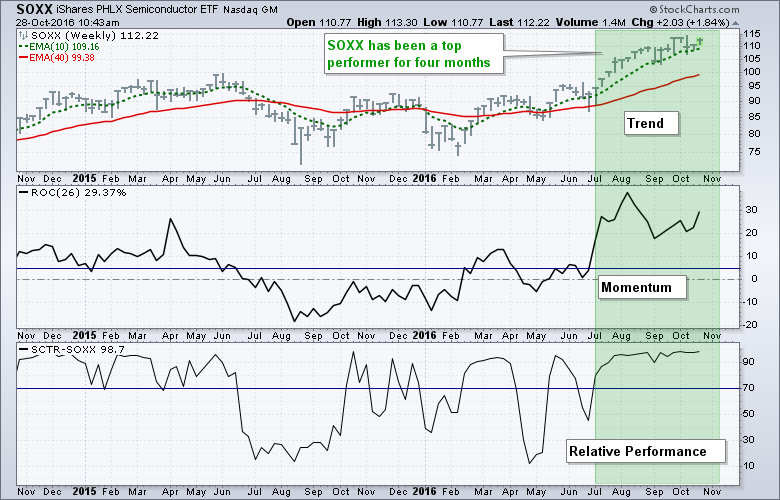
Now that we have our ETF universe and a minimum volume requirement, it is time to ensure that the ETF is in a long-term uptrend. There are many indicators we can use to identify the long-term trend. These include the 26-week Aroon Oscillator (positive or negative), the weekly Percentage Price Oscillator (PPO) or moving averages. For now, I will opt for a basic 10-week EMA and 40-week EMA. The trend is up as long as the 10-week EMA is above the 40-week EMA and this requirement is captured in the third line of the scan code.
[favorites list is 251] // AH-ETF 0100 ETF Master Daily ChartList*
AND [SMA(250,volume) > 200000 ] // average volume minimum
AND [Weekly EMA(10,close) > Weekly EMA(40,close)] // long-term uptrend
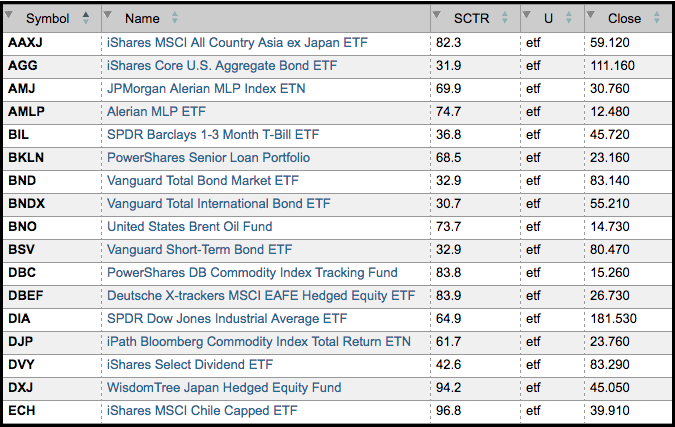
I ran this scan on October 27th and 139 of the 161 eligible ETFs are in long-term uptrends. The majority of the ETFs on this list are stock related so this is positive for the equity markets. There are also several non-equity ETFs in long-term uptrends so this suggests that the financial markets are doing ok. Below is a screen shot showing the first 17 results (sorted alphabetically).
Ranking by StockCharts Technical Rank
Most ETFs have a StockCharts Technical Rank (SCTR) that is automatically included in the scan results. Users simply need to click the SCTR column head to sort by this value. ETFs with the highest SCTRs will then be shown at the top and this makes it easy to identify the leaders.
Note that the SCTR ranges from 0 to 100 and this system ranks the ETF universe in deciles. ETFs scoring between 90 and 100 are in the top decile. ETFs scoring between 80 and 90 are in the second decile. And so on and so forth. In general, ETFs with an SCTR above 70 will be in the top 30% for performance and this is a good starting point.
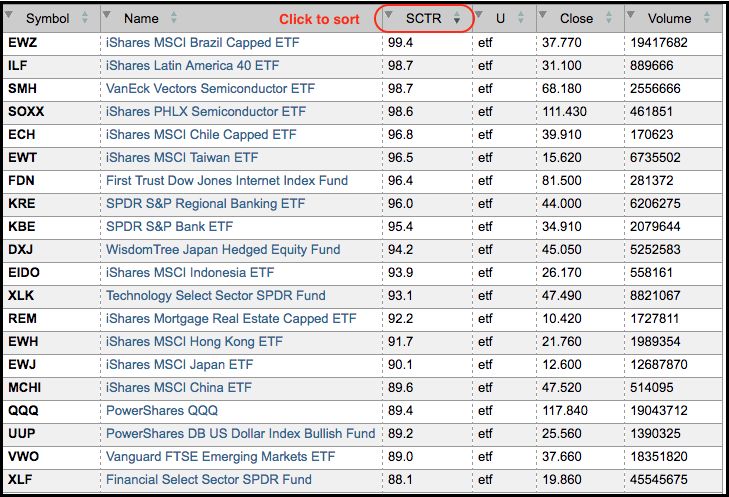
The table above shows several equity-related ETFs in the top decile (>90). We are seeing high SCTRs for the finance and technology sectors, as well as for banks and semiconductors. Yes, two semiconductor ETFs got in this ChartList. Outside the US, we are seeing strength in Latin America, Brazil, Indonesia, China, and Emerging Markets. Overall, it is a pretty positive picture for global equities. Chartists wishing to isolate ETFs with a high SCTR (above 70) can add the following line to their scan code.
AND [SCTR > 70]
Ranking By Pure Momentum
The purest of all momentum indicators is the Rate-of-Change. The 26-week Rate-of-Change shows the percentage change over a 26-week period, which is around six months. ETFs with the highest Rate-of-Change show the strongest momentum and these are the clear leaders. Users can scan using the Rate-of-Change indicator and also rank by its value. Simply precede the scan phrase with "Rank by" and place line as the last scan criteria.
Rank by Weekly ROC(26)
The example below shows the entire scan code and the results would be ranked by the 26-week Rate-of-Change.
[group is ETFNOUI] // symbol universe is ETF (NO inverse or leverage)â
AND [SMA(250,volume) > 200000 ] // average volume minimum
AND [Weekly EMA(10,close) > Weekly EMA(40,close)] // long-term uptrend
Rank by Weekly ROC(26)
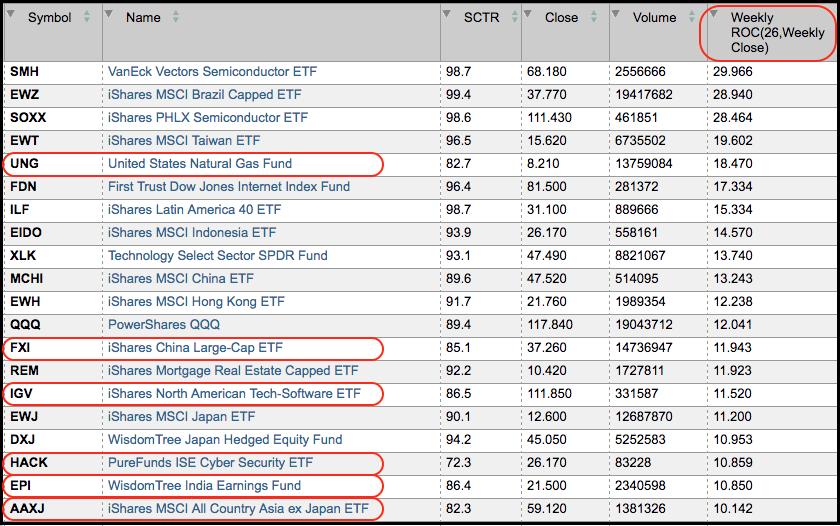
The table below shows the ETFs with the biggest Rate-of-Change and this list is similar to the top SCTRs. There are some differences with the red outlines showing ETFs that made the top tier based on Rate-of-Change, but did not make the top tier based on SCTR.
Narrowing and Exporting Scan Results
The goal of this scan is to find top performing ETFs in uptrends for further analysis. SCTRs and Rate-of-Change can be used to identify the leaders and we can use them together. First, look at the SCTR sort and then look at the Rate-of-Change ranking. Second, choose a cut-off point for each. I am going to choose 70 for the SCTRs and 5% for Rate-of-Change. Third, add these cut-off points to your scan code. I am showing the entire scan code below with the last two lines defining the SCTR and Rate-of-Change cutoffs.
[group is ETFNOUI] // symbol universe is ETF (NO inverse or leverage)
AND [SMA(250,volume) > 200000 ] // average volume minimum
AND [Weekly EMA(10,close) > Weekly EMA(40,close)] // long-term uptrend
AND [Weekly ROC(26) > 5] // six month ROC is above 5%
AND [SCTR > 70] // SCTR is above 70 (top 30%)
After running this scan, we have narrowed the ETF universe to just 39 ETFs. We started with a universe of 311 ETFs and narrowed it to 161 based on average volume. Next, we added a trend filter and reduced this list to 139 ETFs. The Rate-of-Change and SCTR filters were added and this left us with 39 ETFs. These ETFs have good volume, they are in uptrends and they show relative strength. Now it is time to start analyzing some charts.
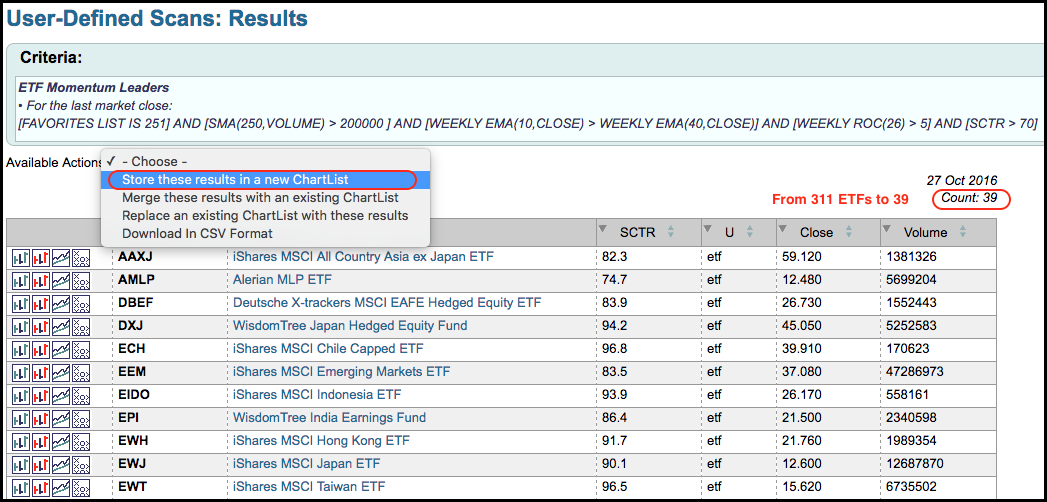 The screen shot above comes from the scan results based on the 27-October close. There is a drop-down menu for "Available Options". Among other options, users can merge these results with an existing ChartList or put them in a new ChartList. I like to put the results in a new ChartList and then name it using the date (e.g. ETF Momentum Leaders 161027). I can then analyze these charts with my favorite indicators and find trading setups.
Analyzing with CandleGlance and RSI
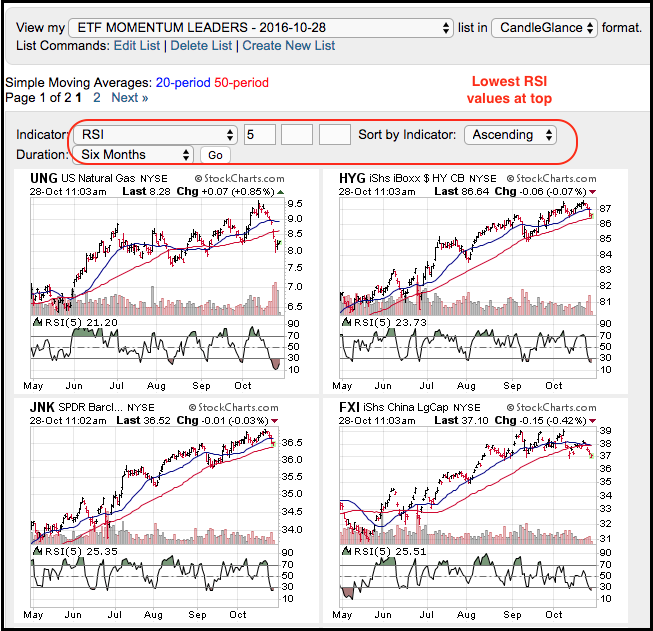
Once I have narrowed my list, I like to use CandleGlance charts to look for indicator setups. Yes, you can add indicators to CandleGlance charts. First, choose CandleGlance for the "format" at the upper right. Second, select an "indicator" from the drop-down list above the CandleGlance charts. Third, select the duration for the chart and the periods for the indicator. And finally, sort the indicator by "Ascending" to see ETFs with the lowest RSI value at the top. These will be the ETFs that are the most oversold for the short-term.
Conclusions
Consider this a framework for building your own scans and developing your own strategy for trading ETFs. One size does not always fit all. Using these techniques, it is possible to work on a long-term trend-following strategy, a weekly momentum strategy or a short-term mean-reversion trading strategy. Developing a strategy and sticking with that strategy is probably the single most important aspect of trading or investing.  ******************************************************
Measuring Risk On-Risk Off - Using charts to quantify stock, economic and credit risk.
PPO Trading Strategy - How to use 3 PPOs to develop a trend-reversion trading strategy.
Long-term Trend Indicators - Using the PPO, EMA Slope and CCI to determine the trend.
ETF Master ChartPack - 300+ ETFs organized in a Master ChartList and in individual groups.
Follow me on Twitter @arthurhill - Keep up with my 140 character commentaries.
****************************************
Thanks for tuning in and have a good day!
--Arthur Hill CMT
Plan your Trade and Trade your Plan
*****************************************


