 Webinar Video -- Art's Charts ChartList
Performance for the First Ten Months .... Two Steps Forward and One Step Backward .... SPY Holds with a Spinning Top .... QQQ Continues to Lead .... RSI Does the Double Dip for IWM .... Webinar Preview .... //// ....
Performance for the First Ten Months
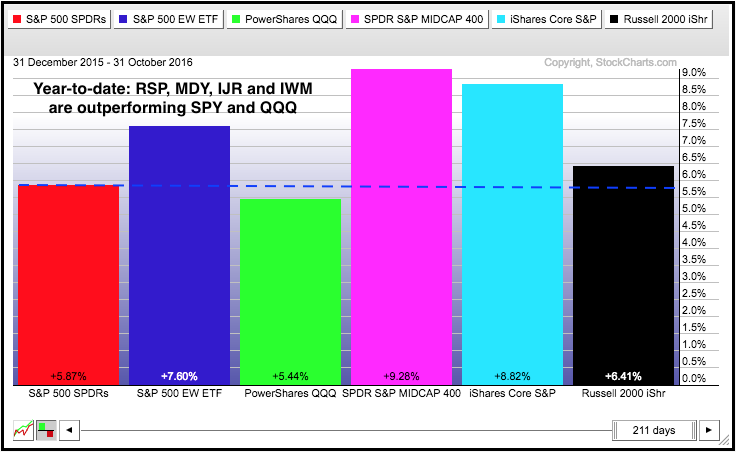
Even though we have seen choppy price action over the last few months, the major index ETFs are still up year-to-date and over the last six months. In fact, chartists should note that equal-weight, mid-caps and small-caps are leading over the last ten months. The PerfChart below shows the EW S&P 500 ETF (RSP), the S&P MidCap SPDR (MDY) and S&P SmallCap iShares (IJR) with the biggest year-to-date gains. It can't be all that bad with SPY up around 6% the first ten months and these three leading the market.
Two Steps Forward and One Step Backward
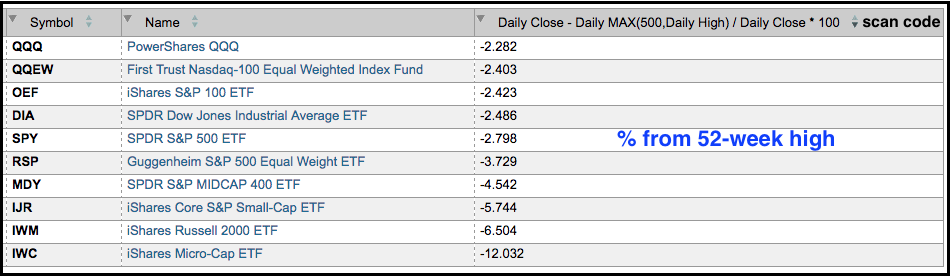
There are basically two moves to focus on right now. First, the major index ETFs surged from the Brexit lows in late June and hit 52-week highs in July-August-September. This represents two steps forward. The second move is what happened after the 52-week highs. Some ETFs corrected, some traded flat and some hit new highs just last week (QQQ). This move represents one step backward. The table below shows the percentage distance from the recent peak for 10 major index ETFs. Small-caps and micro-caps are the furthest from their higher, while large-caps and large-techs are the closest. Small-caps corrected the hardest, but they also advanced the most during the prior surge.
Bottom Line: The bigger uptrend is the dominant force and I am using this to set my broad market bias. This means I am focused on bullish setups and bullish resolutions. Conversely, I am ignoring short-term support breaks, bearish MACD crosses, bearish candlestick patterns and the like.
SPY Holds with a Spinning Top
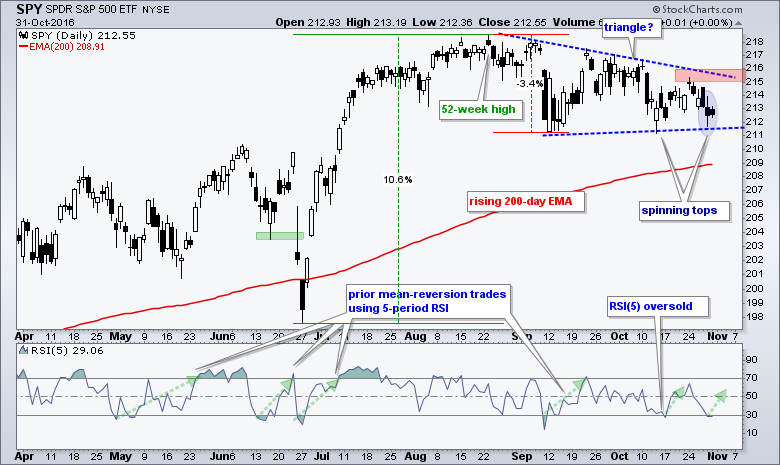
Let's start with the SPY chart below. The ETF surged around 10% and then corrected with a triangle over the last two months (blue lines). A spinning top formed on Friday and this shows indecision (blue oval). Also notice that a spinning top formed two weeks ago with the dip below 212. Spinning tops denote indecision that can lead to a short-term reversal. Furthermore, note that SPY is near its prior lows ("support") and RSI(5) is oversold. A gap and nice gain today would forge a short-term reversal. A follow through breakout at 216 would suggest that the correction is ending and the bigger uptrend is resuming.
QQQ Continues to Lead
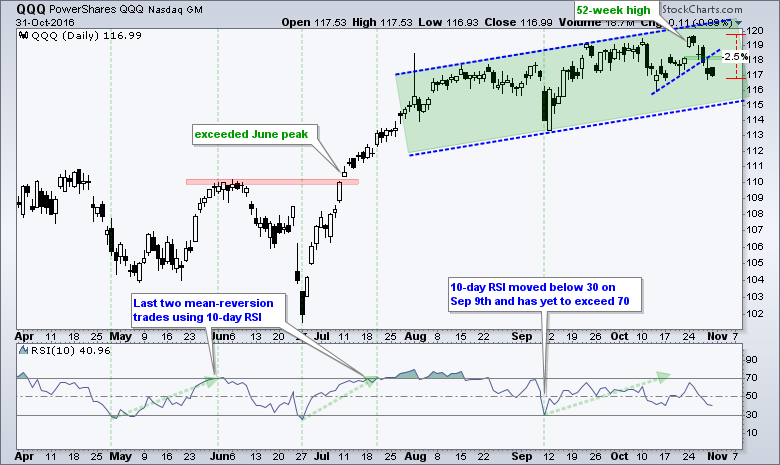
The QQQ chart highlights a rising channel of sorts with 52-week highs in September and October. Even though QQQ broke "support" with the 5-day decline, it is not a threat to the overall uptrend right now.
RSI Does the Double Dip for IWM
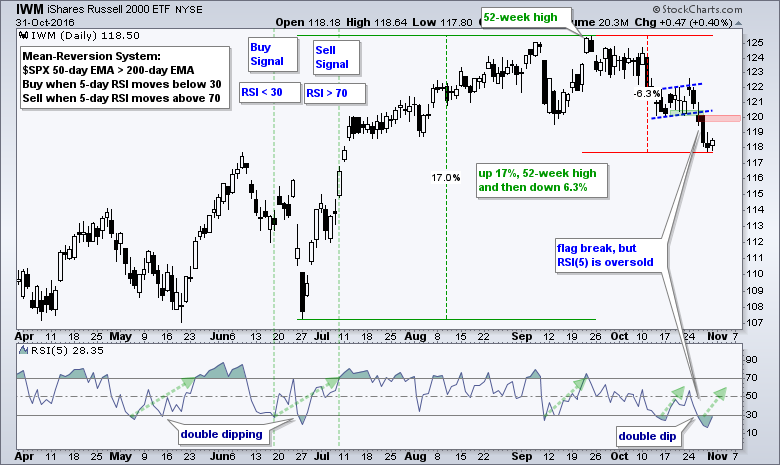
IWM shows the two steps forward with the 17% surge (June to Sept) and the 6.3% decline (late September to late October). This decline retraced 37% of the prior advance. IWM broke flag "support" with a sharp decline last week and RSI(5) became oversold with a double dip. I am now watching 120. A close above this level would negate the flag break and provide the first clue that IWM is getting its bullish mojo back.
******************************************************
Measuring Risk On-Risk Off - Using charts to quantify stock, economic and credit risk.
PPO Trading Strategy - How to use 3 PPOs to develop a trend-reversion trading strategy.
Long-term Trend Indicators - Using the PPO, EMA Slope and CCI to determine the trend.
ETF Master ChartPack - 300+ ETFs organized in a Master ChartList and in individual groups.
Follow me on Twitter @arthurhill - Keep up with my 140 character commentaries.
****************************************
Thanks for tuning in and have a good day!
--Arthur Hill CMT
Plan your Trade and Trade your Plan
*****************************************


