Offensive Sectors Lead Defensive Sectors ..... Consumer Discretionary ETFs Hit New Highs .... Risk Ratios Hit New Highs .... This Week's Articles and ChartList .... Another Bullish Breadth Surge .... Marking Pullback Support for SPY .... Biotech ETFs Hold Gaps .... Medical Devices ETF Bounces off Retracement .... //// ....
Offensive Sectors Lead Defensive Sectors ....
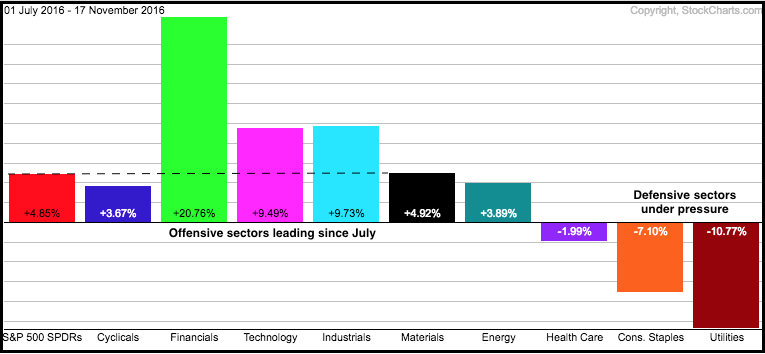
The market began its move to riskier assets in July and this move simply accelerated over the last two weeks. Note that stocks (risk assets) bottomed in late June and Treasury bonds (safe-haven assets) peaked in early July. The S&P 500 is now close to a new all-time high and the 20+ YR T-Bond ETF (TLT) is down around 15% since early July. The strong appetite for risk is also reflected in sector performance since July. The Utilities SPDR (XLU) and Consumer Staples SPDR (XLP) also peaked in the first part of July and both are down sharply the last four months. Conversely, three of the four offensive sectors are leading the market with bigger gains than SPY (finance, technology and industrials).
Consumer Discretionary ETFs Hit New Highs
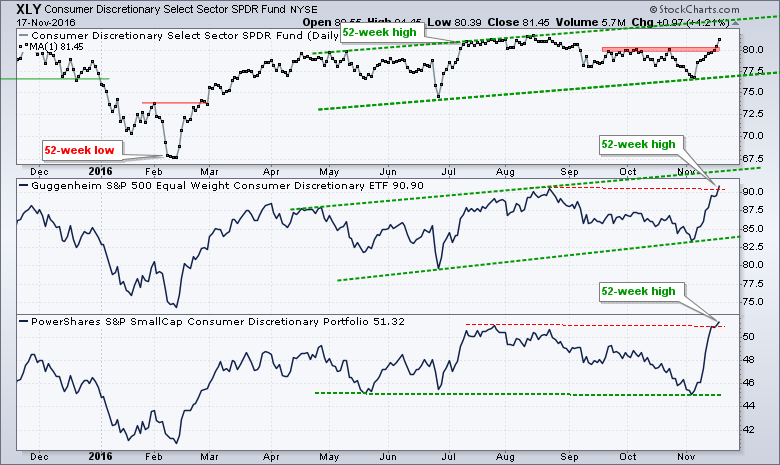
Even though Consumer Discretionary SPDR (XLY), which represents the fourth offensive sector, is still lagging overall, the chart below shows XLY catching a strong bid and breaking above its October highs. The EW Consumer Discretionary ETF (RCD) and the SmallCap Consumer Discretionary ETF (PSCD) show even more strength with 52-week highs on Thursday. This is the most economically sensitive sector and broad strength bodes well for economic prospects. All in all, this is bullish for stocks and reinforces the bull market environment, which has been in effect since late March.
Risk Ratios Hit New Highs
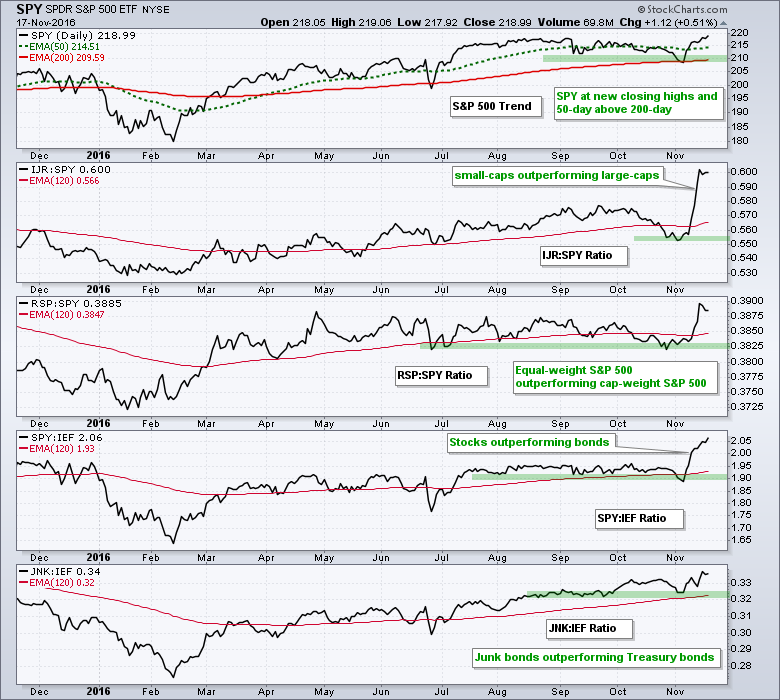
The chart below shows five risk ratios hitting new highs this week. First, SPY hit a new closing high and the 50-day EMA remains above the 200-day EMA. Second, small-caps are outperforming large-caps and this shows a healthy appetite for risk within the stock market. Similarly, the EW S&P 500 ETF (RSP) is also outperforming SPY. Third, stocks are outperforming Treasury bonds because the SPY:IEF ratio surged to a new high. Money is moving out of the bond market and finding its way into riskier assets, such as stocks. And finally, junk bonds (risk) continue to outperform Treasury bonds as the JNK:IEF ratio hit a new high for the year.
This Week's Articles and ChartList
Spotting Pullbacks within an Uptrend .... Trading with MACD-Histogram and RSI .... Scan Code for Pullbacks .... Microsoft and Apple Trigger Signals
Market Shows Broad Strength - Overbought is not Bearish - Don't Blame all Techs - Economically Sensitive Sector Perks Up - Webinar Video 42 minutes
System Trader - How to become a Smooth Operator with Moving Averages - Backtesting Different Moving Average Pairs
Art's Charts ChartList updated on 18-Nov. Note that I featured several big tech stocks on Tuesday (AAPL, AMZN, CSCO, FB, GILD, GOOGL, INTC and MSFT). These charts remain and I added another 13 stocks.
Another Bullish Breadth Surge
There was a big improvement in S&P 1500 breadth over the last nine trading days. The 10-day EMA of AD Percent surged above +20%, High-Low Percent exceeded +20% on Monday and the %Above 200-day EMA moved above 70%. Note that this last indicator is based on a user-defined indicator I created from S&P 500 %Above 200-day EMA (!GT200SPX), Mid-Cap %Above 200-day EMA (!GT200MID) and Small-Cap %Above 200-day EMA (!GT200SML). Basically, the stock market experienced the biggest positive breadth thrust since early July and High-Low Percent hit its highest level since October 2013. This expansion of new highs is very bullish for the market.
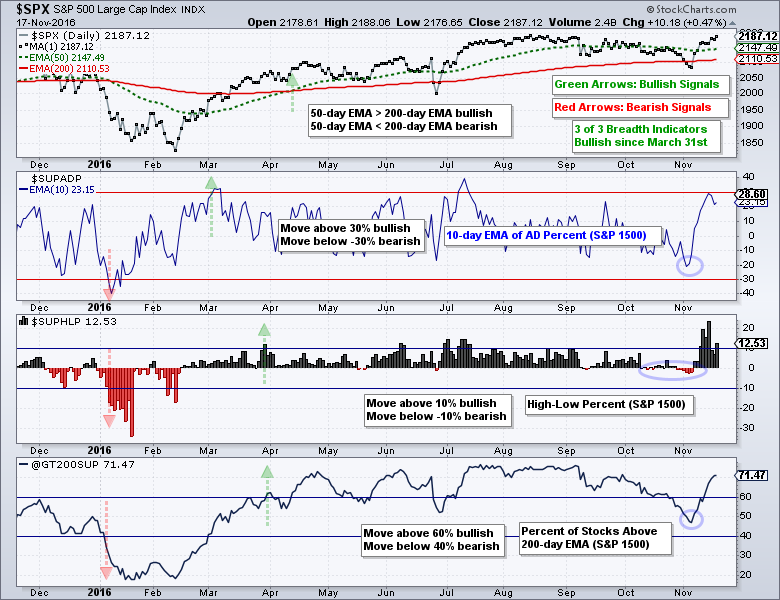
The blue ovals mark corrective periods for these indicators. I say corrective because the breadth indicators have been net bullish since late March when all three exceeded their bullish thresholds. It is important to distinguish between a mere correction and a more serious decline. Once we have bullish signals in place, I consider any decline to be corrective until it triggers a bearish signal. The breadth indicators never triggered bearish signals and this is why I thought these declines were mere corrections. Thus, the weight of the evidence has been bullish since
Marking Pullback Support for SPY
As far as I am concerned, the S&P 500 is the only index we need to determine the trend for the broader market. My rational for this assessment is detailed in the article links above (Backtesting Different Moving Average Pairs). In addition, it is hard to beat the 50-day EMA and 200-day EMA for broad market timing. The chart below shows SPY with the PPO(50,200,1) in the indicator window. This indicator is positive when the 50-day EMA is above the 200-day EMA and negative otherwise. Note that the PPO has been positive since April 1st. The 50-day EMA crossed above the 200-day EMA for the S&P 500 a little later (April 13th) because this index does not include dividends.
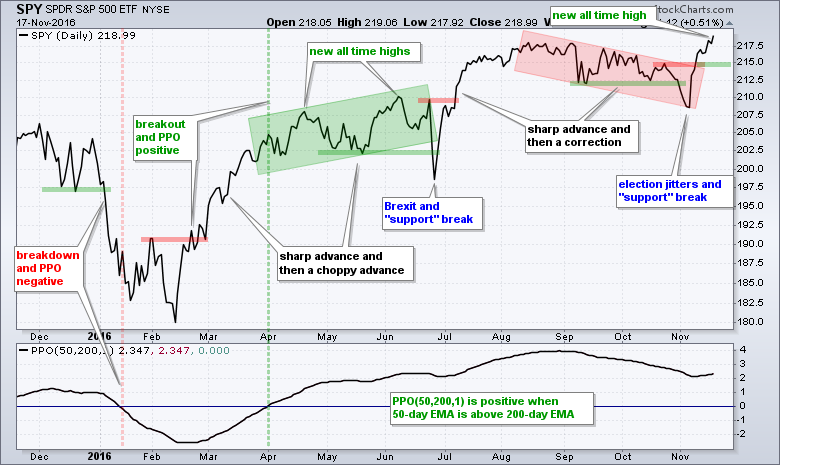
On the price chart, I would like to focus on two moves. First, there was the February-March surge and then a slower-choppier advance (green zone). SPY even broke "support" with the Brexit debacle and then raced to new highs. Second, there was the July surge and then a correction (red zone). SPY also broke "support" and then raced to new highs. "Support" breaks, it turn out, are not all that bad when the weight of the evidence is bullish (breadth, risk ratios, 50/200 day EMAs).
This brings us to the current situation. SPY has surged and now we are wondering what will happen next. Guess what? Nobody knows. My guess is that we could see a choppy and slower advance the next two months. Almost all indicators are bullish, seasonality is bullish until yearend and we could even see some performance chasing from underinvested portfolio managers. Broken resistance in the 215 area could offer support on a short pullback and provide an opportunity.
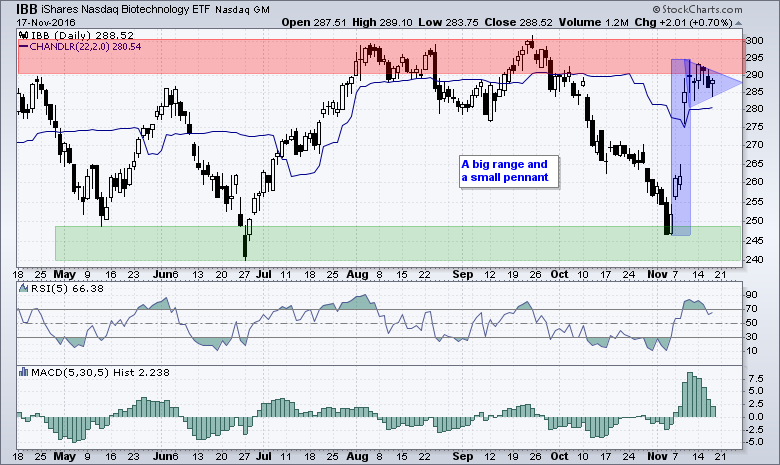
Biotech ETFs Hold Gaps
I featured a trading strategy using 5-day RSI to identify pullbacks and the MACD Histogram (5,30,5) to identify a subsequent upturn. This is a hybrid strategy that combines mean-reversion (RSI) with a small upturn (MACD). This, of course, is only half of a system because I did not offer an exit strategy. I plan to backtest this system when I develop an exit strategy, which means lots of trial and error. In the meantime, chartists can consider a trailing stop based on the low before the entry and then move to a Chandelier Exit.
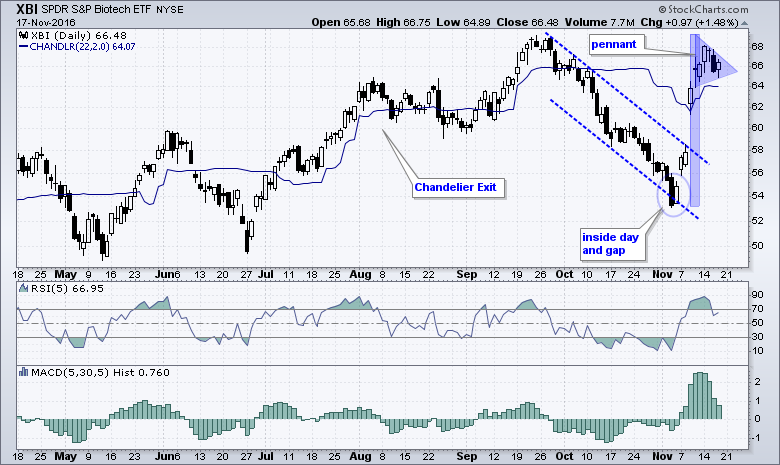
The chart above shows the Biotech SPDR (XBI) with RSI(5) and the MACD Histogram (5,30,5). I am showing XBI because it may not pull back. Everyone is waiting for a pullback and has a habit of not obliging the crowd. The ETF surged around 25% and then stalled the last few days. It is possible that a pennant is taking shape and a breakout at 68 would signal a continuation higher. The Chandelier Exit could act as a stop-loss level (close below 64). The Chandelier Level (22,2) is set 2 ATR values below the 22-day high and rises when prices move above the 22-day high. The alternative to a pennant breakout would be a pullback that pushes RSI below 30 to create a short-term oversold condition.
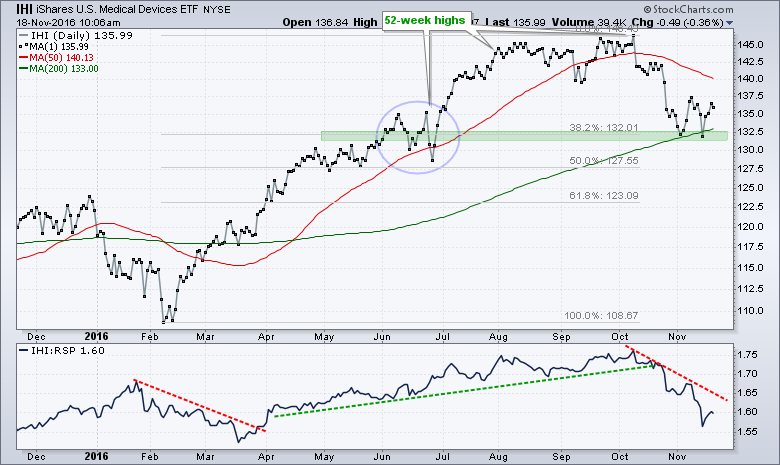
Medical Devices ETF Bounces off Retracement
The next chart shows the Medical Devices ETF (IHI) finding support in the 132 area with two bounces this month. This is a potential reversal zone because it is near the 38.2% retracement and in the middle of the June consolidation (blue oval).
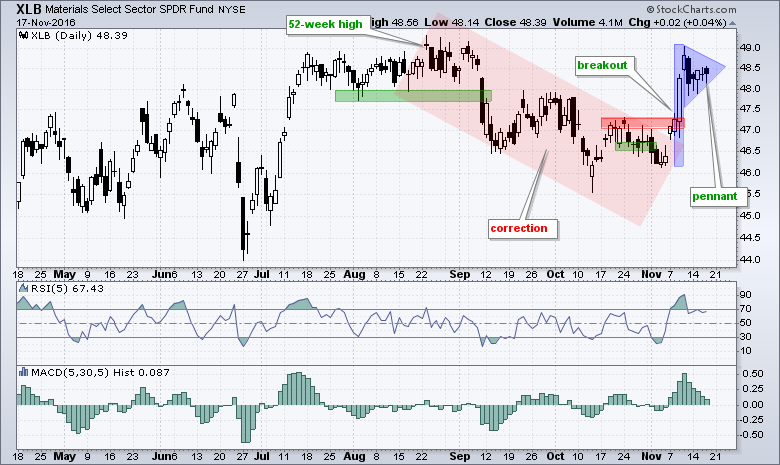
Although not related to biotechs, the Materials SPDR (XLB) has a similar setup working with a surge and pennant.
******************************************************
Measuring Risk On-Risk Off - Using charts to quantify stock, economic and credit risk.
PPO Trading Strategy - How to use 3 PPOs to develop a trend-reversion trading strategy.
Long-term Trend Indicators - Using the PPO, EMA Slope and CCI to determine the trend.
ETF Master ChartPack - 300+ ETFs organized in a Master ChartList and in individual groups.
Follow me on Twitter @arthurhill - Keep up with my 140 character commentaries.
****************************************
Thanks for tuning in and have a good day!
--Arthur Hill CMT
Plan your Trade and Trade your Plan
*****************************************


